Risk disclaimer: 76% of retail investor accounts lose money when trading CFDs and Spreadbets with this provider. You should consider whether you understand how CFDs and Spreadbets work and whether you can afford to take the high risk of losing your money.
Nasdaq 100 Technical Analysis | Tech giants drive Nasdaq surge on AI optimism
BY Janne Muta
|November 22, 2023Nasdaq 100 Technical Analysis - Lower yields have triggered a rally in technology stocks, driving the NASDAQ index to year-to-date (YTD) highs. Yields have moved lower as investors have been buying bonds in response to increased speculation that the Fed would not raise rates anymore but instead would be likely to cut rates next year.
Major technology companies such as Apple, Microsoft, Amazon, and NVIDIA have been key contributors to the NASDAQ’s performance. With the AI theme buoying these stocks, investors are betting that these major players will lead the market in this field in the coming years, and their performance will remain strong, potentially leading to further rallies in the index.
However, it is important to note that investor expectations may not always materialize, so traders should incorporate price action-based NASDAQ technical analysis into their decision-making processes.
The November FOMC meeting minutes reveal that the rate-setting committee's stance is one of caution. According to the minutes labour market in Fed’s view remains tight but has eased slightly, and inflation, though high, has moderated over the past year.
The consensus is that policy should remain restrictive until inflation is sustainably moving toward the objective, but there is acknowledgment of uncertainty in the economic outlook.
Summary of This Nasdaq 100 Technical Analysis Report:
- The NASDAQ rallied almost 6% after the index broke out of a bearish trend channel three weeks ago. Now, the market is attempting to break above the July high at 15,931.
- In the daily chart, the nearest key support level is at 15,732. Above this level, the market is likely to continue higher, while a decisive break below could drive the market down to 15,530.
- Major technology companies such as Apple, Microsoft, Amazon, and NVIDIA have been key contributors to the NASDAQ’s performance. With the AI theme buoying these stocks, investors are betting that these major players will lead the market in this field in the coming years, and their performance will remain strong, potentially leading to further rallies in the index.
Read the full Nasdaq 100 technical analysis report below.
Nasdaq 100 Technical Analysis
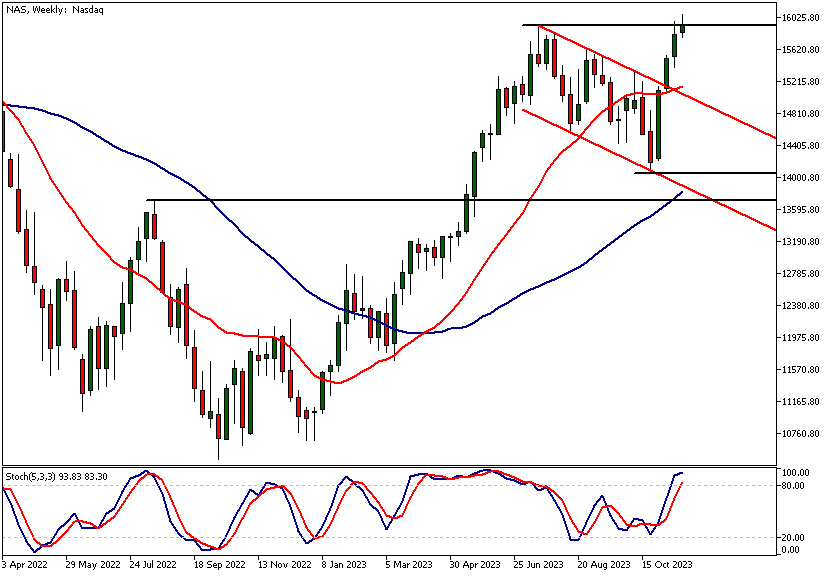
Weekly Nasdaq 100 Technical Analysis
The NASDAQ rallied almost 6% after the index broke out of a bearish trend channel three weeks ago. Now, the market is attempting to break above the July high at 15,931. After the index peaked above this level, it created a new YTD high at 16,063.
Both the 20-period moving average and the 50-period moving average are pointing higher, with the fast moving average above the slow one. At the same time, the stochastic oscillator has moved into the overbought area, coinciding with the market trading at a major resistance level.
Indicator-based NASDAQ 100 technical analysis therefore indicates that the market is bullish but could be temporarily overbought.
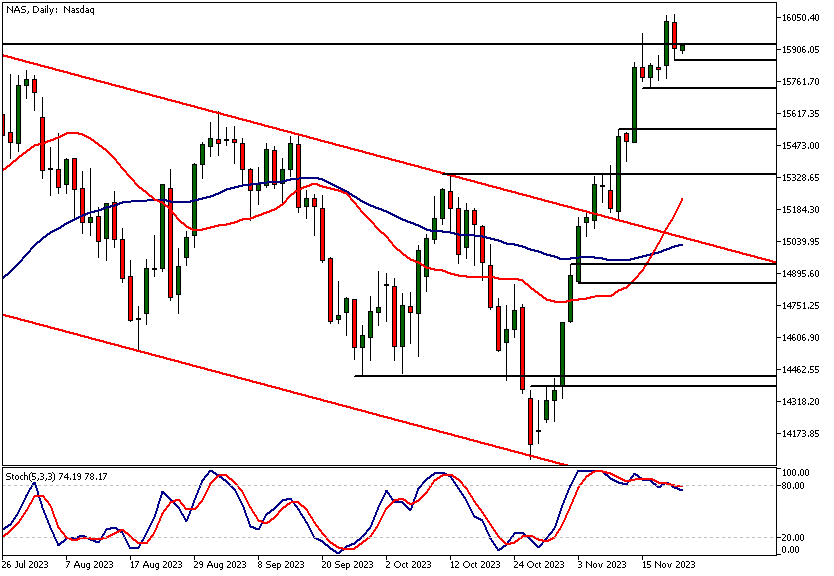
Daily Nasdaq 100 Technical Analysis
In the daily chart, the nearest key support level is at 15,732. Above this level, the market is likely to continue higher, while a decisive break below could drive the market down to 15,530. If the bullish sentiment is maintained and the market finds further demand above yesterday's high at 16,063, the bulls could target 16,170.
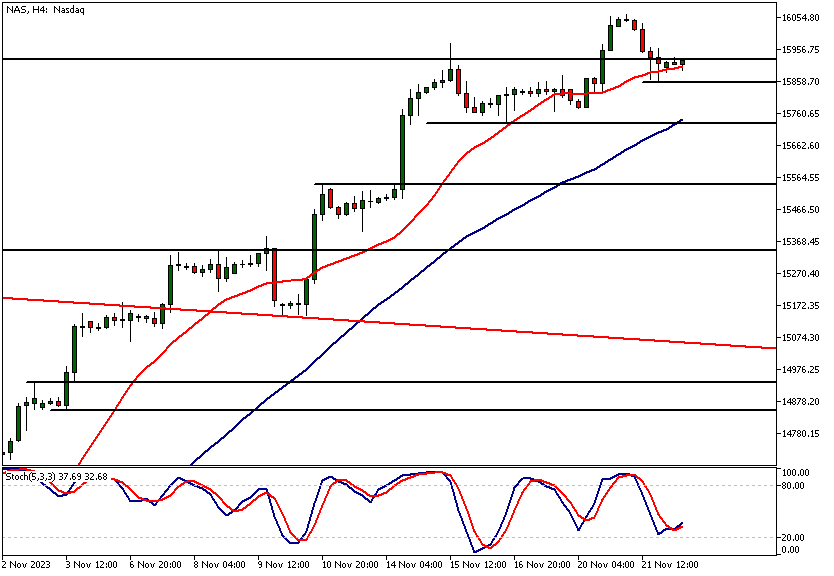
Nasdaq 100 Technical Analysis, 4h Chart
The 4-hour chart reveals a fairly similar picture to the daily chart. The market has been trending higher, consistently creating higher lows and higher highs. This process defines the key support levels traders focus on and could therefore provide us with trading opportunities.
The nearest support level in the 4-hour chart is the 15,856 low, formed in the US session yesterday, making it a valid support level. Should the market fail to attract enough buying at this level, we could see it testing the next key price point at 15,732. This level coincides with the 50-period moving average and could therefore be deemed a more important level than the 15,856 support.
Moving averages indicate bullishness
Indicator-based NASDAQ 100 technical analysis shows the moving averages in a bullish order, with the fast moving average above the slow one. At the same time, the stochastic oscillator is just about to give a buy signal, with the oscillator line moving above the signal line.
However, the market is trading at levels very close to a major resistance level (the earlier YTD high). While this alone isn't a reason to short the market, long trades at such significant resistance levels could be riskier than earlier in the trend.
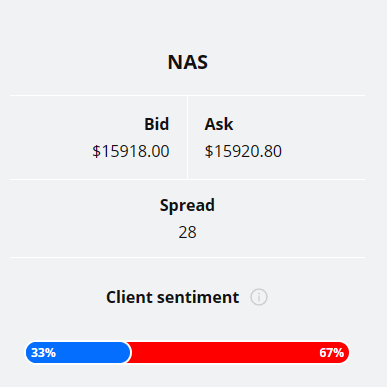
Client sentiment analysis
TIOmarkets' clientele are bearish on Nasdaq with 67% of the client base short and 33% long in the market.
Please remember that the retail trader client sentiment is a contrarian indicator as most of the retail traders are on average betting against the market trends. This is why, experienced traders tend to trade against the retail client sentiment. You can follow the TIOmarkets client sentiment live on our Forex dashboard.
The next key risk events for this market
- USD - FOMC Meeting Minutes
- USD - Unemployment Claims
- USD - Core Durable Goods Orders
- USD - Durable Goods Orders
- USD - Revised UoM Consumer Sentiment
- USD - Flash Manufacturing PMI
- USD - Flash Services PMI

Potential Nasdaq 100 Market Moves
Our Nasdaq 100 technical analysis indicates that if the market can continue to push higher and attract buyers above 15,932, we could see the market moving to 16,250. Alternatively, a failure to push decidedly above the YTD high could see a move to 15,533 as likely.
How would you trade the Nasdaq 100 today?
I hope this Nasdaq 100 technical analysis helps you to make better informed trading decisions. Check the latest market analysis for other instruments and subscribe to receive them in your inbox as soon as they are published
While research has been undertaken to compile the above content, it remains an informational and educational piece only. None of the content provided constitutes any form of investment advice.
TIO Markets UK Limited is a company registered in England and Wales under company number 06592025 and is authorised and regulated by the Financial Conduct Authority FRN: 488900
Risk warning: CFDs are complex instruments and come with a high risk of losing money rapidly due to leverage. 73% of retail investor accounts lose money when trading CFDs with this provider. You should consider whether you understand how CFDs work and whether you can afford to take the high risk of losing your money. Professional clients can lose more than they deposit. All trading involves risk.
DISCLAIMER: TIO Markets offers an exclusively execution-only service. The views expressed are for information purposes only. None of the content provided constitutes any form of investment advice. The comments are made available purely for educational and marketing purposes and do NOT constitute advice or investment recommendation (and should not be considered as such) and do not in any way constitute an invitation to acquire any financial instrument or product. TIOmarkets and its affiliates and consultants are not liable for any damages that may be caused by individual comments or statements by TIOmarkets analysis and assumes no liability with respect to the completeness and correctness of the content presented. The investor is solely responsible for the risk of his/her investment decisions. The analyses and comments presented do not include any consideration of your personal investment objectives, financial circumstances, or needs. The content has not been prepared in accordance with any legal requirements for financial analysis and must, therefore, be viewed by the reader as marketing information. TIOmarkets prohibits duplication or publication without explicit approval.

Janne Muta holds an M.Sc in finance and has over 20 years experience in analysing and trading the financial markets.
