Risk disclaimer: 76% of retail investor accounts lose money when trading CFDs and Spreadbets with this provider. You should consider whether you understand how CFDs and Spreadbets work and whether you can afford to take the high risk of losing your money.
Nasdaq 100 Technical Analysis | Dollar rise softens the bids
BY Janne Muta
|January 17, 2024Nasdaq 100 Technical Analysis - In the US, equity markets declined and the dollar strengthened due to doubts about central banks' willingness to reduce interest rates. Federal Reserve Governor Christopher Waller emphasized the need for sustained low inflation before considering rate cuts.
Also, renewed concerns over Red Sea attacks have increased fears about supply chain disruptions and geopolitical tensions, boosting the dollar to a one-month high.
Major US stock indices fell, with the US Treasury yield reaching its highest since mid-December. The S&P 500, Nasdaq Composite, and Dow Jones Industrial Average all closed slightly lower in 2024, with futures selling off overnight, indicating a bearish near-term outlook for stocks.
Investor optimism diminished causing bond prices to fall and 10-year Treasury yields to rise to 4.064%. This trend bolstered the dollar, which traded higher for the fourth consecutive day.
The fourth-quarter earnings season began with S&P 500 companies reporting lower growth expectations. Companies are now challenged to demonstrate profitability as stock momentum slows.
Elsewhere, China’s economy faced challenges in 2023, including a persistent property crisis, deflationary pressures, and weak consumer demand. Despite stimulus calls, GDP growth was 5.2% in the fourth quarter, up from 4.9% in Q3 but below the 5.3% forecast.
Summary of This Nasdaq 100 Technical Analysis Report:
- NASDAQ exhibits weakness after nearing its all-time high, with resistance at 16,971. It's fluctuated between 16,176 and 16,971 recently. Potential decline to 16,615 or 16,420; however, a sentiment shift could push it towards 16,850. Key support is at 16,176.
- NASDAQ's inability to progress, forming narrow range candles, suggests risk aversion and uncertainty, creating a potential lower high at 16,908. A decisive fall below 16,612 could confirm this, hinting at further drops. The range between 16,612 and 16,908 indicates potential movement to 16,320 or 17,156.
- On the eight-hour chart, NASDAQ is supported by a rising trend line and the SMA(50), forming a bullish triangle. A breakout above the triangle could challenge the all-time high at 16,971, while a break below could target support levels at 16,608, 16,615, and 16,420.
Read the full Nasdaq 100 technical analysis report below.
Nasdaq 100 Technical Analysis

Weekly Nasdaq 100 Technical Analysis
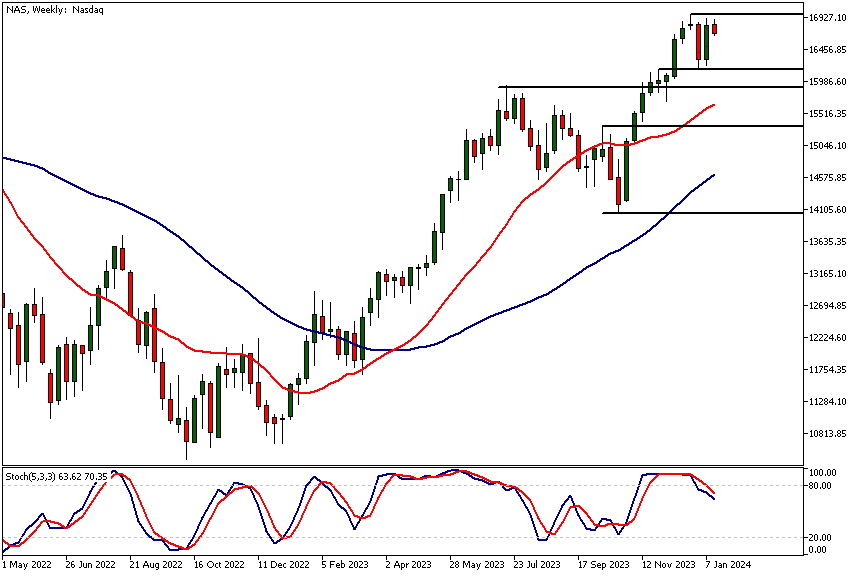
The NASDAQ is showing signs of weakness after rallying last week close to its all-time high level (16,971). The line of least resistance appears to be downwards, with the all-time high nearby acting as a significant resistance level. Over the past two weeks, the index has ranged between 16,176 and the all-time high at 16,971.
Potential targets
If the weakness persists, the market could decline to 16,615 and then possibly to 16,420. Conversely, if there is a sudden change in market sentiment, a rise to 16,850 could be likely. The nearest key weekly support level is at the recent range low of 16,176.
Our Nasdaq 100 technical analysis indicates that the current weakness could be only short-term, as the moving averages are still trending upwards, and the market has been making higher lows and higher highs. The stochastic oscillator is pointing lower, indicating a lack of momentum in the market.

Daily Nasdaq 100 Technical Analysis
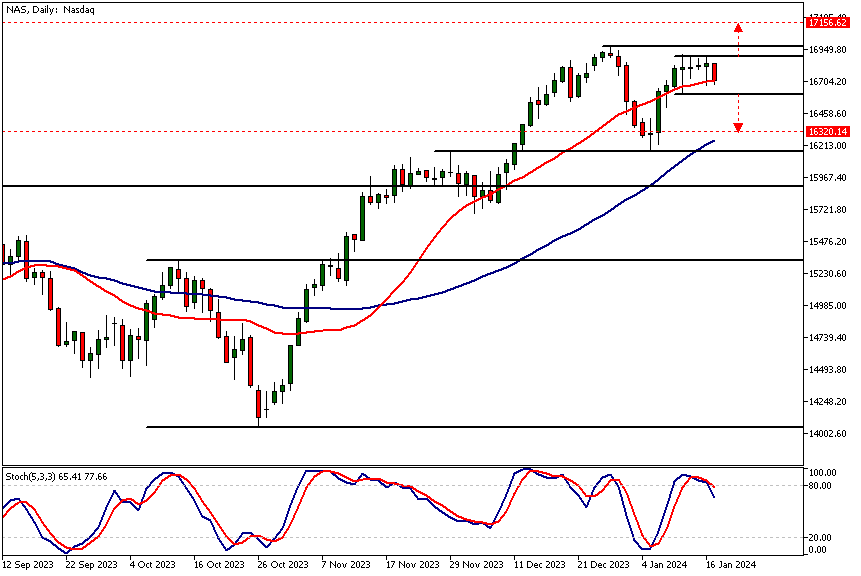
For several days, Nasdaq has been unable to advance, creating narrow range candles, indicating indecisiveness and a reluctance to take risks. This has potentially created a lower reactionary high at 16,908.
If the market decisively breaks below 16,612, a lower reactionary high will have been confirmed, which is bearish as lower reactionary highs often lead to the market breaking the next key support levels.
Trading range and measured move targets
The latest range (between 16,612 and 16,908) provides measured move targets at 16,320 on the downside and 17,156 on the upside. The lower target aligns closely with the SMA(50), and the upper target.
If bond market weakness continues (yields increase), the likelihood of a bearish breakout from the range in Nasdaq increases. We would need to see renewed buying above the range low and a decisive break above 16,908 to make the upside target a likely one.
According to moving averages-based Nasdaq 100 technical analysis, the market is still in a medium-term uptrend as the SMA(20) is above the SMA(50) and pointing higher. The market is currently trading at the SMA(20). The stochastic oscillator has given a sell signal and is pointing lower, indicating weakness in momentum.

Intraday Nasdaq 100 Technical Analysis
The eight-hour chart shows the Nasdaq reacting to rising trend line support, closely aligned with the SMA(50). With the trend line below the market and the market bouncing higher from it, a bullish triangle is forming.
Nasdaq 100 technical analysis shows the index is trading at a pivotal level that could lead to an intraday rally, and if the momentum continues and the market breaks above the triangle high, we might see it testing the ATH at 16,971. Alternatively, a decisive break below the triangle could lead to the market breaking the 16,608 support level. This could bring 16,615 and then possibly 16,420 levels into play.

Client sentiment analysis
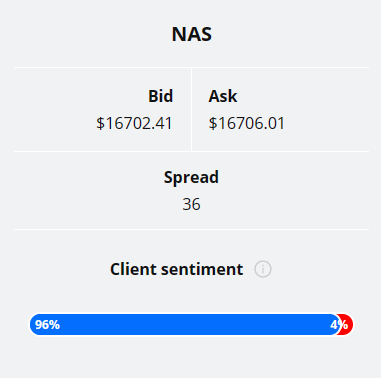
96% of clients trading Nasdaq are holding long positions, while 4% are holding short positions. Client sentiment data is being provided by TIO Markets Ltd.
Please note that retail client trading sentiment is generally a contrarian indicator, as private (non professional) traders, on average, trade against market price trends. You can follow the TIOmarkets client sentiment live on our Forex dashboard.
The next key risk events for this market
- USD - Core Retail Sales m/m
- USD - Retail Sales m/m
- USD - Industrial Production m/m
- USD - Unemployment Claims
- USD - Building Permits
- USD - Philly Fed Manufacturing Index
- USD - Prelim UoM Consumer Sentiment
- USD - Existing Home Sales
- USD - Prelim UoM Inflation Expectations
Potential Nasdaq 100 Market Moves
Nasdaq 100 technical analysis shows the index is trading at a pivotal level that could lead to an intraday rally, and if the momentum continues and the market breaks above the triangle high, we might see it testing the ATH at 16,971.
Alternatively, a decisive break below the triangle could lead to the market breaking the 16,608 support level. This could bring 16,615 and then possibly 16,420 levels into play.

How Would You Trade The Nasdaq 100 Today?
I hope this Nasdaq 100 technical analysis helps you to make better informed trading decisions. Check the latest market analysis for other instruments and subscribe to receive them in your inbox as soon as they are published
While research has been undertaken to compile the above content, it remains an informational and educational piece only. None of the content provided constitutes any form of investment advice.
TIO Markets UK Limited is a company registered in England and Wales under company number 06592025 and is authorised and regulated by the Financial Conduct Authority FRN: 488900
Risk warning: CFDs are complex instruments and come with a high risk of losing money rapidly due to leverage. 73% of retail investor accounts lose money when trading CFDs with this provider. You should consider whether you understand how CFDs work and whether you can afford to take the high risk of losing your money. Professional clients can lose more than they deposit. All trading involves risk.
DISCLAIMER: TIO Markets offers an exclusively execution-only service. The views expressed are for information purposes only. None of the content provided constitutes any form of investment advice. The comments are made available purely for educational and marketing purposes and do NOT constitute advice or investment recommendation (and should not be considered as such) and do not in any way constitute an invitation to acquire any financial instrument or product. TIOmarkets and its affiliates and consultants are not liable for any damages that may be caused by individual comments or statements by TIOmarkets analysis and assumes no liability with respect to the completeness and correctness of the content presented. The investor is solely responsible for the risk of his/her investment decisions. The analyses and comments presented do not include any consideration of your personal investment objectives, financial circumstances, or needs. The content has not been prepared in accordance with any legal requirements for financial analysis and must, therefore, be viewed by the reader as marketing information. TIOmarkets prohibits duplication or publication without explicit approval.

Janne Muta holds an M.Sc in finance and has over 20 years experience in analysing and trading the financial markets.
