Risk disclaimer: 76% of retail investor accounts lose money when trading CFDs and Spreadbets with this provider. You should consider whether you understand how CFDs and Spreadbets work and whether you can afford to take the high risk of losing your money.
Gold Technical Analysis | Can gold break above 1969.86?
BY Janne Muta
|November 15, 2023Gold Technical Analysis - Gold rally was boosted yesterday by the belief that the Fed might not hike anymore but would be instead cutting the rates next year. In October, the U.S. annual inflation rate decreased to 3.2%, underperforming forecasts of 3.3%. This reduction was driven by significant declines in energy costs, while food, shelter, and new vehicle prices increased at a slower pace. The core CPI also rose less than expected, both yearly and monthly.
Today's retail sales, an important indicator of both inflation and the health of the US economy indicates weakness after a period of growth. Consumers have so far remained strong but now the October retail sales dipped by 0.1%, marking the first decline since March and indicating a cooling.
According to WSJ consumers reduced spending in areas like auto dealerships, gas stations, and various stores, likely due to higher interest rates and declining savings. Despite this, spending increased in restaurants, bars, grocery stores, and online.
At the same time, the job market is showing signs of slowing as the Federal Reserve's interest rate hikes are impacting borrowing costs which contributes to cautious consumer spending.
Summary of This Gold Technical Analysis Report:
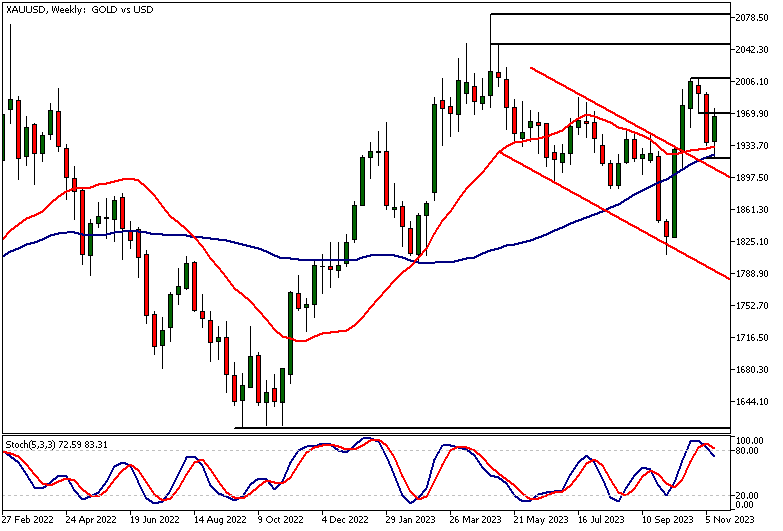
- After moving down to the 50-period moving average in the weekly chart, gold has rallied strongly higher. The markets don't believe the Fed hikes the rates anymore. If this leads to further weakening in the dollar, we could see the gold bulls targeting the 1986 level. Alternatively, if gold can't exceed the resistance level at 2009.38, a move down to 1953 or so could take place.
- Three days ago, gold created a higher swing low at 1919 and closed significantly above the day's low. As a result, a bullish rejection candle was created, and a strong rally higher followed.
- The lower than expected US CPI reading propelled the price of gold higher yesterday, and the rally has continued today. Now the market is trying to break above a key market structure level at 1969.86. If we continue to see strength in the gold market, the bulls could be targeting the 1986 level.
Read the full gold technical analysis report below.
Gold Technical Analysis
Weekly Gold Technical Analysis
asdf
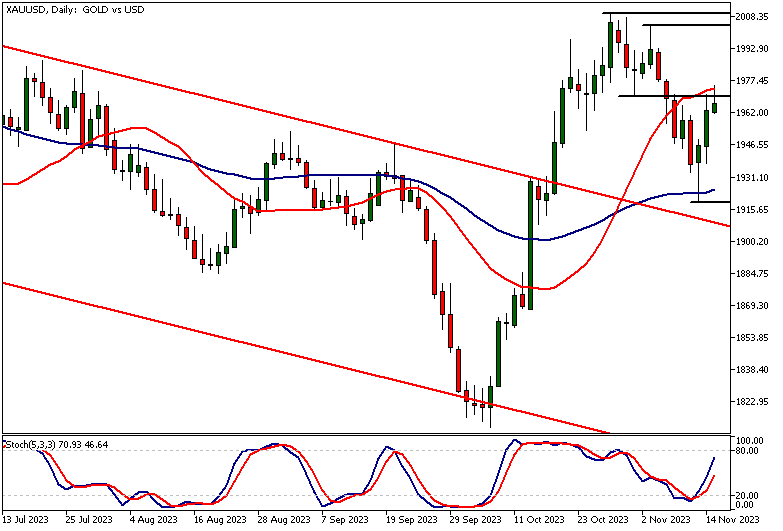
Daily Gold Technical Analysis
After moving down to the 50-period moving average in the weekly chart, gold has rallied strongly higher. Price action over the next week or so should provide us with further clues on whether this week's low is going to be a higher swing low.
If it is, then we could see the market breaking above the 2009.38 high. The reasons to believe that this week's low could be a new higher swing low are twofold. Firstly, gold technical analysis shows how the market has just recently broken out of a bearish trend channel, so the retracement to the downside could have been just one of those return moves we often see after a breakout.
Secondly, the markets don't believe the Fed hikes the rates anymore. If this leads to further weakening in the dollar, we could see the gold market moving higher. Alternatively, if gold can't exceed the resistance level at 2009.38, a move down to levels near the October low would not be a surprise.
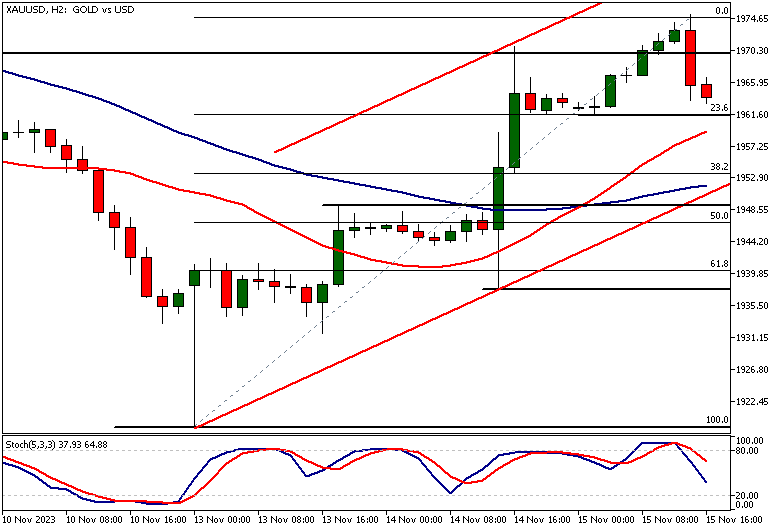
Gold Technical Analysis, 2h
The two-hour chart shows how gold is approaching a level where the 23.6% Fibonacci retracement level and the nearest support level at 1961.54 are very closely aligned. Note that the 20-period moving average, currently at 1958.60, is fairly close by also.
As the market is trending higher in this timeframe, the combination of these technical factors could attract buyers around the 19580 – 1961 range. Should it fail to do so, gold technical analysis indicates that the next key technical level to potentially come into play is the 38.2% Fibonacci retracement level (1953). This level roughly coincides with the 50-period moving average and the bullish channel low.
Should there be a deeper retracement in the price of gold, it's worth monitoring how the market reacts to these levels and whether we can see signs of buying emerging.
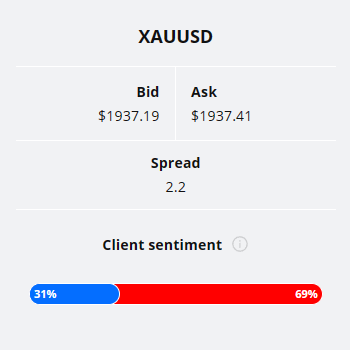
Client sentiment analysis
A majority of TIOmarkets' clients are skeptical about gold's prospects, as 69% hold short positions while only 31% are optimistic with long positions.
Please remember that the retail trader client sentiment is a contrarian indicator as most of the retail traders are on average betting against the market trends. This is why, experienced traders tend to trade against the retail client sentiment. You can follow the TIOmarkets client sentiment live on our Forex dashboard.
The next key risk events impacting this market:
- Unemployment Claims
- Philly Fed Manufacturing Index
- Industrial Production
Potential Gold Market Moves
The lower than expected US CPI reading propelled the price of gold higher yesterday, and the rally has continued today. Now the market is trying to break above a key market structure level at 1969.86. If we continue to see strength in the gold market, the bulls could be targeting the 1986 level. Alternatively, the market might move down to levels near the bull channel low.

How would you trade the Gold today?
I hope this fundamental and technical Gold analysis helps you to make better informed trading decisions. Check the latest market analysis for other instruments and subscribe to receive them in your inbox as soon as they are published
While research has been undertaken to compile the above content, it remains an informational and educational piece only. None of the content provided constitutes any form of investment advice.
TIO Markets UK Limited is a company registered in England and Wales under company number 06592025 and is authorised and regulated by the Financial Conduct Authority FRN: 488900
Risk warning: CFDs are complex instruments and come with a high risk of losing money rapidly due to leverage. 73% of retail investor accounts lose money when trading CFDs with this provider. You should consider whether you understand how CFDs work and whether you can afford to take the high risk of losing your money. Professional clients can lose more than they deposit. All trading involves risk.
DISCLAIMER: TIO Markets offers an exclusively execution-only service. The views expressed are for information purposes only. None of the content provided constitutes any form of investment advice. The comments are made available purely for educational and marketing purposes and do NOT constitute advice or investment recommendation (and should not be considered as such) and do not in any way constitute an invitation to acquire any financial instrument or product. TIOmarkets and its affiliates and consultants are not liable for any damages that may be caused by individual comments or statements by TIOmarkets analysis and assumes no liability with respect to the completeness and correctness of the content presented. The investor is solely responsible for the risk of his/her investment decisions. The analyses and comments presented do not include any consideration of your personal investment objectives, financial circumstances, or needs. The content has not been prepared in accordance with any legal requirements for financial analysis and must, therefore, be viewed by the reader as marketing information. TIOmarkets prohibits duplication or publication without explicit approval.

Janne Muta holds an M.Sc in finance and has over 20 years experience in analysing and trading the financial markets.
