Risk disclaimer: 76% of retail investor accounts lose money when trading CFDs and Spreadbets with this provider. You should consider whether you understand how CFDs and Spreadbets work and whether you can afford to take the high risk of losing your money.
Gold analysis | Israel-Hamas War Fuels 10% Rally
BY Janne Muta
|October 26, 2023Gold Analysis - Gold has rallied approximately 10% since the September low as the Hamas attack on Israel led to a massive rally with traders seeking for safe havens. The momentum has remained relatively strong in the weekly chart even after the market moved to a key resistance level at 1987.
US Bond Yields
The Israel-Hamas war has driven the price of gold sharply higher. The high bond yields in the US have not been able to halt the strong rally that has taken gold roughly 10% higher from the September low.
US Political Factors
Another, albeit less impactful factor on the rising gold prices has been the fear that the US government shutdown might soon be a reality due to the inability among US republican lawmakers to choose a new house speaker.
Risk Beyond Gaza
Furthermore, the risk of the Israel-Hamas war spreading beyond Gaza and Israel is a concern. Former US Army general Ben Hodges told Deutsche Welle that Russia and Iran are orchestrating the war between Hamas and Israel.
Russia's Involvement
According to Hodges, the biggest beneficiary of the war is Russia. He believes the Kremlin is working with Iran to orchestrate the conflict. This could give a reason for Israel to attack Iran, risking further escalation of the conflict. Market participants are hedging their bets by decreasing their holdings in equities and adding gold to their portfolios.
The next key risk events for Gold
- US Advance GDP
- US Unemployment Claims
- US Core PCE Price Index
- Revised UoM Consumer Sentiment
For more information and details see the TIOmarkets economic calendar.
Read the full Gold analysis report below.
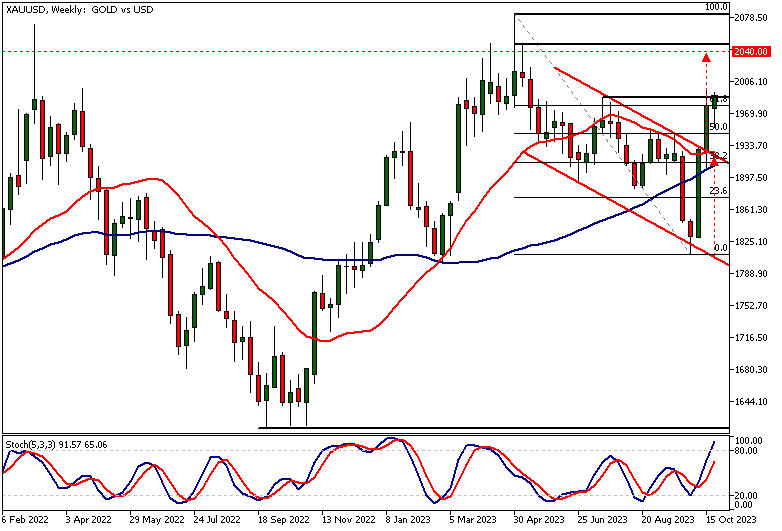
Gold Analysis, Weekly Chart
Gold has rallied approximately 10% since the September low. The Hamas attack on Israel led to a massive rally as traders sought to find safe havens. The momentum has remained relatively strong in the weekly chart even after the market moved to a key resistance level at 1987.
Stochastic Oscillator
The Stochastic Oscillator has crossed over to the overbought zone but the measured move target at 2040 is still some 2.4% from the current market price.
The measured move target is based on the width of the earlier bear channel. And, now that the market has been extremely strong and with the Middle East crisis still supporting the flight to safety mentality we could still see more upside. Therefore the overbought condition alone is not a reason to sell this market short or to exit long positions.
Moving Averages
The moving averages are bullish with the SMA(20) above the SMA(50). This indicates a long-term bullish bias in the price of gold. Together with the recent strong upside momentum and with the Israel - Hamas war ongoing the bulls could be targeting the 2040 measured move target price.
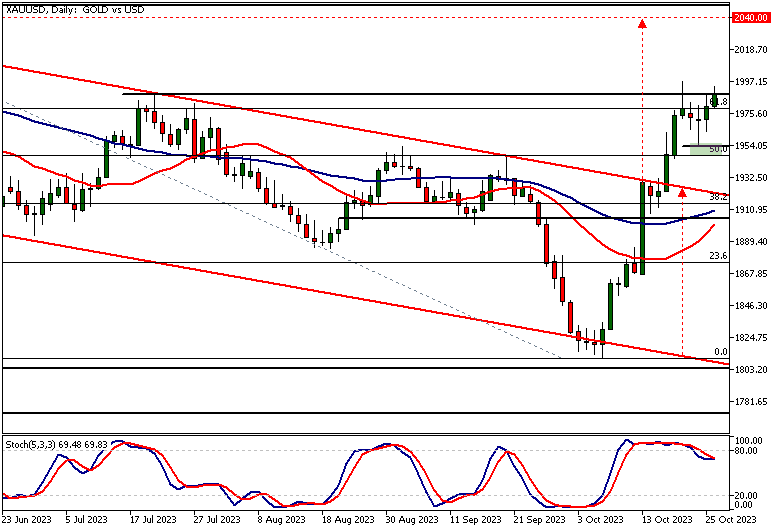
Gold Analysis, Daily Chart
The daily chart shows Gold reacting to the July high at 1987 and retracing a bit before the bears had to once again give up at 1953.64. This level, near the 50% Fibonacci retracement level, is now the nearest key support level and the bullish price action (higher daily lows) above the level suggests the market could still be moving higher.
Stochastic and SMAs
The stochastic oscillator is pointing to the downside but the SMAs are starting to turn higher. Should the upside momentum fail and the market closed decisively below the 1953.64 level, look for a return move to the bear channel high (currently at 1920). Above the 1953.64 level, we could see a move to 2040.

Gold Analysis, 8h Chart
The 8h chart shows the XAUUSD in a sideways range between the 1953.64 support level and the 1997.14 high. The lower end of the range coincides with the 23.6% Fibonacci retracement level suggesting the level is followed by a significant number of traders.
Bullish Moving Averages
The moving averages are bullish and suggest the sideways range could be resolved to the upside. This would be in line with our Gold analysis in the daily and weekly sections above.
Key Support Levels
Should the market break below the range low, the nearest key support levels below 1953.64 are at 1908 and 1930.
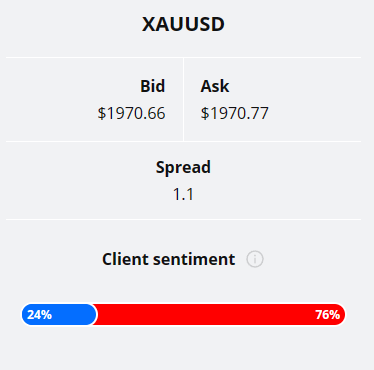
Client sentiment analysis
TIOmarkets clients are bearish on gold with 76% of clients holding short positions and 24% holding long positions in the market.
Please remember that the retail trader client sentiment is a contrarian indicator as most of the retail traders are on average betting against the market trends. This is why, experienced traders tend to trade against the retail client sentiment. You can follow the TIOmarkets client sentiment live on our Forex dashboard.

Conclusion (Bullish and bearish scenarios)
On the bullish side, geopolitical tensions and fears of a broader conflict in the Middle East continue to serve as a catalyst for the upside momentum. The ongoing Israel-Hamas conflict, compounded by potential geopolitical orchestration by Russia and Iran, continues to drive investors toward gold as a safe haven.
Conversely, in the daily timeframe chart, the Stochastic Oscillator has reached overbought levels, and a decisive close below the 1953.64 level could signal a bearish reversal, with support levels at 1908 and 1930 looming below.
We hope our gold analysis report helps our readers to make better trading decisions.
While research has been undertaken to compile the above content, it remains an informational and educational piece only. None of the content provided constitutes any form of investment advice.
Tio Markets UK Limited is a company registered in England and Wales under company number 06592025 and is authorised and regulated by the Financial Conduct Authority FRN: 488900
Risk warning: CFDs are complex instruments and come with a high risk of losing money rapidly due to leverage. 82% of retail investor accounts lose money when trading CFDs with this provider. You should consider whether you understand how CFDs work and whether you can afford to take the high risk of losing your money. Professional clients can lose more than they deposit. All trading involves risk.
DISCLAIMER: Tio Markets offers an exclusively execution-only service. The views expressed are for information purposes only. None of the content provided constitutes any form of investment advice. The comments are made available purely for educational and marketing purposes and do NOT constitute advice or investment recommendation (and should not be considered as such) and do not in any way constitute an invitation to acquire any financial instrument or product. TIOmarkets and its affiliates and consultants are not liable for any damages that may be caused by individual comments or statements by TIOmarkets analysis and assumes no liability with respect to the completeness and correctness of the content presented. The investor is solely responsible for the risk of his/her investment decisions. The analyses and comments presented do not include any consideration of your personal investment objectives, financial circumstances, or needs. The content has not been prepared in accordance with any legal requirements for financial analysis and must, therefore, be viewed by the reader as marketing information. TIOmarkets prohibits duplication or publication without explicit approval.

Janne Muta holds an M.Sc in finance and has over 20 years experience in analysing and trading the financial markets.
