Risk disclaimer: 76% of retail investor accounts lose money when trading CFDs and Spreadbets with this provider. You should consider whether you understand how CFDs and Spreadbets work and whether you can afford to take the high risk of losing your money.
EURUSD Technical Analysis | Weekly rejection candle triggers a sell-off
BY Janne Muta
|January 2, 2024EURUSD Technical Analysis - The EURUSD currency pair is trading lower after a bearish weekly candle was formed last week. Traders wait for economic data from Europe and the US as they hope to gain more understanding on potential policy directions of the ECB and the Fed for this year. Key releases include the US ISM Manufacturing PMI and JOLTS job openings data, both due tomorrow.
The ISM Manufacturing PMI, previously at 46.7, indicating sector contraction, is expected to slightly increase to 47.2. JOLTS job openings, which fell to 8.733 million in October 2023, the lowest since March 2021, are forecasted to recover to 8.85 million. This decline in job openings reflects cooling labour demand amid higher borrowing costs and a tighter economy.
Additionally, the FOMC meeting minutes will be published on Wednesday, following the Fed's decision in December 2023 to maintain the federal funds rate at 5.25%-5.5%. Despite moderate job gains and low unemployment, inflation remains a key concern, though it shows signs of easing. The Fed's outlook for 2023 is optimistic, but cautious for 2024, with lowered PCE inflation rates and stable unemployment projections. Market expectations suggest the Fed may cut rates five times in 2024, beginning in March.
Finally, on Friday, before the U.S. Non-Farm Payrolls report (+168K expected), the Euro Area inflation figures will be released. Analysts expect an increase in headline inflation to 3.0% (up from 2.4%), while Core CPI is projected to decrease further to 3.4%, down from 3.6%.
Summary of This EURUSD Technical Analysis Report:
- Last week, EURUSD showed a bearish rejection candle on the weekly chart, signalling possible further decline from the current level. Key support is seen at 1.0723, with potential descent to 1.0830 near the 50-period moving average. Resistance is at last week's low of 1.1008.
- On the daily chart, EURUSD approaches the 50% Fibonacci level at 1.0930, aligning with the 20-period moving average. The market remains in an uptrend within an ascending channel, with support at 1.0723 and a key zone between 1.0826 and 1.0843.
- The 8-hour chart shows EURUSD with support at 1.0880 and 1.0930, near Fibonacci levels and the 50-period moving average. Despite a recent weekly bearish signal, the upward trend remains intact, with the 20-period moving average above the 50-period, suggesting potential upward movement within the ascending channel.
Read the full EURUSD technical analysis report below.
EURUSD Technical Analysis
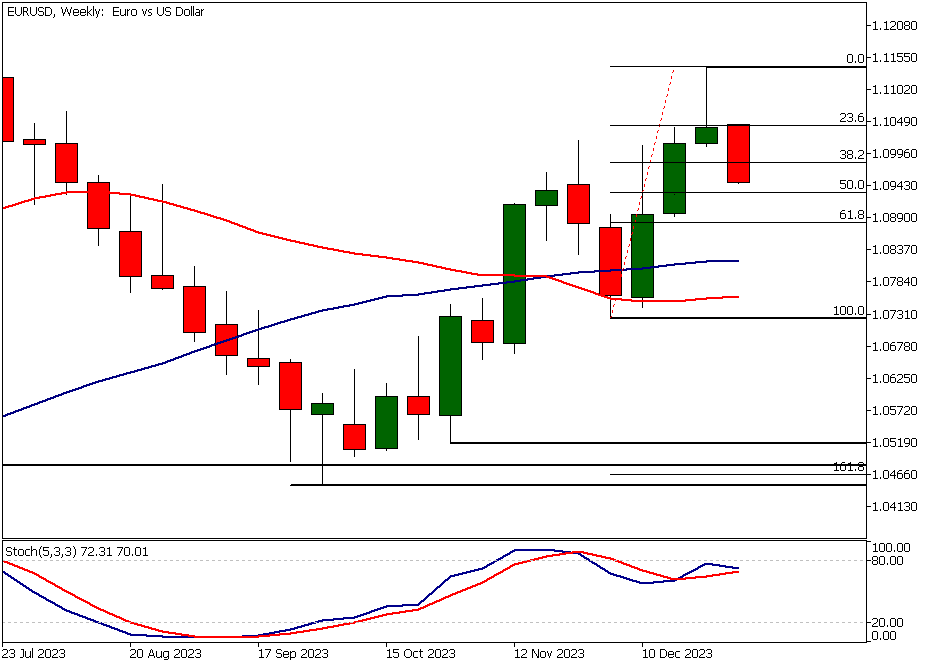
Weekly EURUSD Technical Analysis
Last week, EURUSD formed a bearish rejection candle, indicating institutional selling after a significant upward move in December. Consequently, the market has been trading lower today. On the weekly chart, there are no clear support levels above the December low at 1.0723, suggesting that the current correction could extend further.
Based on the weekly EURUSD technical analysis, the market might eventually trade down to 1.0830. It's noteworthy that the 50-period moving average is at 1.0820. Alternatively, if the market rallies above last week's low of 1.1008, we might see a move to 1.1044.
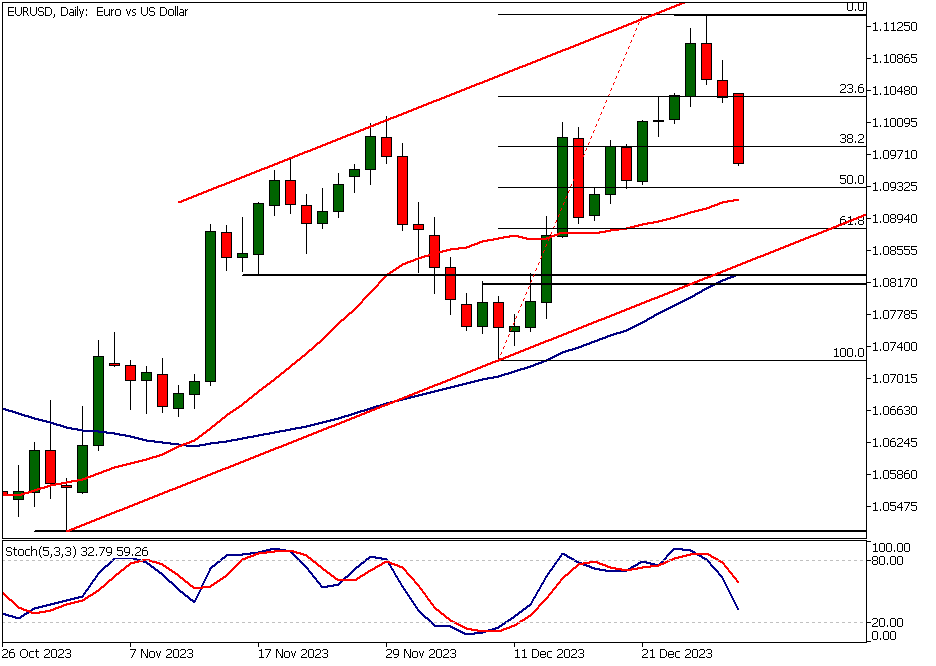
Daily EURUSD Technical Analysis
The market is approaching the 50% Fibonacci retracement level at 1.0930, which is closely aligned with the 20-period moving average at 1.0917. Technically, the market remains in an uptrend on the daily chart as it trades within an ascending trend channel with the nearest higher swing low at 1.0723.
However, weakness in the weekly chart suggests more downside could be ahead before the market is ready to move higher again. The nearest support area is formed by the 50-period moving average and the channel low at 1.0826 and 1.0843.
Market structure area
This area coincides with a market structure area between 1.0817 and 1.0825. As both the 20 and 50-period moving averages are trending upwards, indicator-based EURUSD technical analysis suggests that the market remains bullish, despite the current deep retracement within the trend.
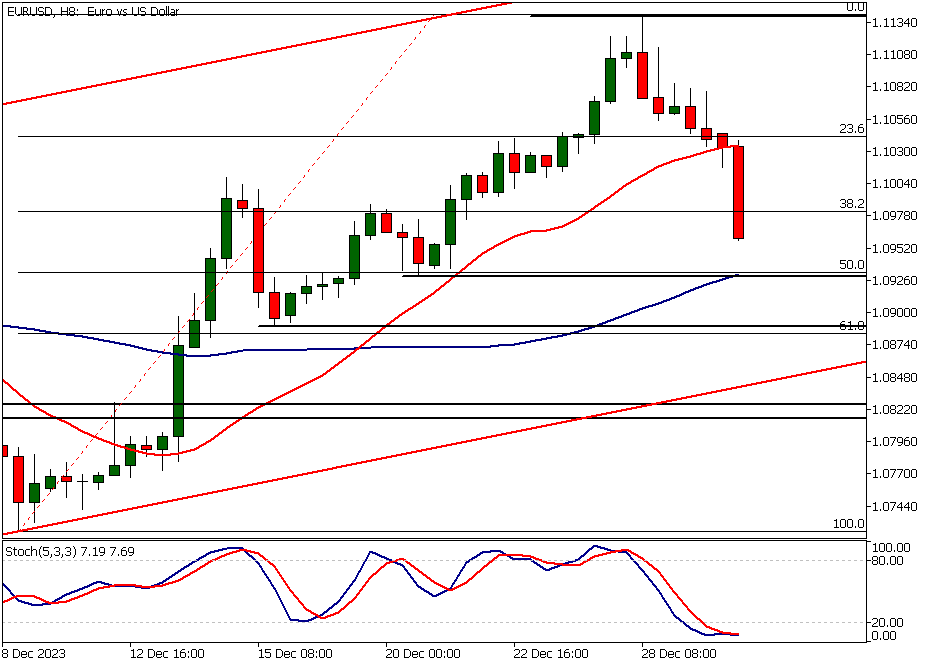
Intraday EURUSD Technical Analysis
The 8-hour chart reveals support levels at 1.0880 and 1.0930. Both levels align closely with Fibonacci retracement levels, and the 1.0930 level also coincides with the 50-period moving average. This technical confluence makes the 1.0930 level particularly significant. Consequently, it could be targeted by bears.
Indicator-based EURUSD technical analysis indicates that the market is in an uptrend, as the 20-period moving average is above the 50-period moving average. However, the recent creation of a weekly rejection candle is a risk factor that cannot be ignored. Therefore, the market might have to fluctuate within the ascending trend channel before the uptrend can resume.
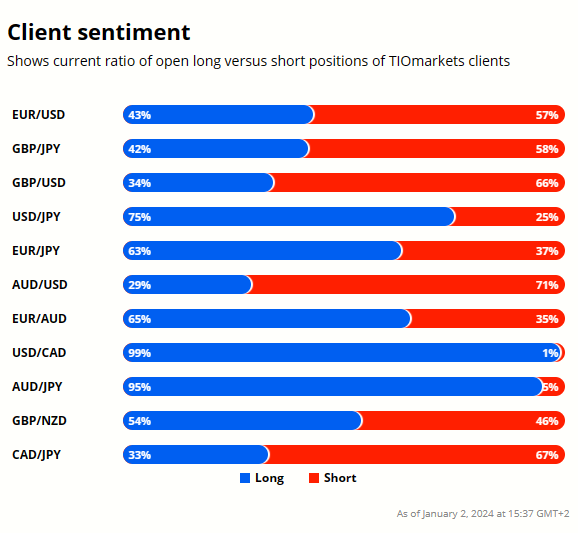
Client sentiment analysis
43% of clients trading EURUSD are holding long positions, while 57% are holding short positions. Client sentiment data is being provided by TIO Markets Ltd.
It’s good to remember that retail client trading sentiment is a contrarian indicator as most retail traders are on average trading against market price trends. This is why experienced traders tend to trade against the retail client sentiment. You can follow the TIOmarkets client sentiment live on our Forex dashboard.
The next key risk events impacting this market
- FOMC Member Barkin Speaks
- ISM Manufacturing PMI
- JOLTS Job Openings
- ISM Manufacturing Prices
- FOMC Meeting Minutes
- German Prelim CPI m/m
- ADP Non-Farm Employment Change
- Unemployment Claims
- Construction PMI
- Core CPI Flash Estimate y/y
- CPI Flash Estimate y/y
- Average Hourly Earnings m/m
- Non-Farm Employment Change
- ISM Services PMI
- FOMC Member Barkin Speaks
Potential EURUSD Market Moves
In a bearish outlook, the pair might continue its decline towards 1.0830, near the 50-period moving average, following the bearish rejection candle on the weekly chart. Alternatively, in a bullish scenario, EURUSD could rebound above last week's low of 1.1008, potentially targeting 1.1044, supported by an overall uptrend on the daily chart and ascending channel.

How Would You Trade EURUSD Today?
I hope this EURUSD technical analysis report helps you to make better informed trading decisions. Check the latest market analysis for other instruments and subscribe to receive them in your inbox as soon as they are published
While research has been undertaken to compile the above content, it remains an informational and educational piece only. None of the content provided constitutes any form of investment advice.
TIO Markets UK Limited is a company registered in England and Wales under company number 06592025 and is authorised and regulated by the Financial Conduct Authority FRN: 488900
Risk warning: CFDs are complex instruments and come with a high risk of losing money rapidly due to leverage. 73% of retail investor accounts lose money when trading CFDs with this provider. You should consider whether you understand how CFDs work and whether you can afford to take the high risk of losing your money. Professional clients can lose more than they deposit. All trading involves risk.
DISCLAIMER: TIO Markets offers an exclusively execution-only service. The views expressed are for information purposes only. None of the content provided constitutes any form of investment advice. The comments are made available purely for educational and marketing purposes and do NOT constitute advice or investment recommendation (and should not be considered as such) and do not in any way constitute an invitation to acquire any financial instrument or product. TIOmarkets and its affiliates and consultants are not liable for any damages that may be caused by individual comments or statements by TIOmarkets analysis and assumes no liability with respect to the completeness and correctness of the content presented. The investor is solely responsible for the risk of his/her investment decisions. The analyses and comments presented do not include any consideration of your personal investment objectives, financial circumstances, or needs. The content has not been prepared in accordance with any legal requirements for financial analysis and must, therefore, be viewed by the reader as marketing information. TIOmarkets prohibits duplication or publication without explicit approval.

Janne Muta holds an M.Sc in finance and has over 20 years experience in analysing and trading the financial markets.
