Risk disclaimer: 76% of retail investor accounts lose money when trading CFDs and Spreadbets with this provider. You should consider whether you understand how CFDs and Spreadbets work and whether you can afford to take the high risk of losing your money.
EURUSD analysis | The ECB expected to pause the rate hikes
BY Janne Muta
|October 26, 2023EURUSD Analysis - The European Central Bank (ECB) is considering halting its 14-month rate-hiking cycle. This has put downward pressure on the Euro throughout the week. Various economic indicators, such as a shrinking eurozone money supply, are signalling a reduced likelihood of immediate policy alterations by the ECB. Additionally, the ECB itself has indicated a forthcoming pause in rate hikes.
U.S. Dollar Strengthens
On the other side of the Atlantic, the U.S. Dollar is showing signs of strengthening. This is attributable to several factors including hawkish expectations surrounding the Federal Reserve, elevated U.S. bond yields, and a generally weaker risk tone in the market. Significantly, the yield on the 10-year U.S. government bond is approaching a 16-year high, further supporting the strength of the U.S. Dollar.
EURUSD stabilizing after a down trend
The EURUSD pair has experienced a significant decline, losing 825 pips or 7.32% from its high in July. However, the market is showing signs of stabilisation, evidenced by higher weekly lows. Despite the recent strengthening of the U.S. Dollar, early bullish indicators are present, such as a buy signal from the Stochastic oscillator.
Key Levels and Indicators
Critical levels to monitor include the 1.0483 support level and the 1.0615 - 1.0635 confluence area, which could serve as points for potential bullish reversals. On the other hand, if the current bearish trend continues, a move towards 1.0267 could be in the cards.
8h Chart and ECB Impact
The 8-hour chart suggests a mild uptrend but is lacking in price action confirmation. The upcoming ECB rate decisions could offer additional insights into the market's future trajectory.
The next key risk events for EURUSD
- ECB Main Refinancing Rate
- ECB Monetary Policy Statement
- US Advance GDP
- ECB Press Conference
For more information and details see the TIOmarkets economic calendar.
Read our full EURUSD analysis report below
EURUSD analysis
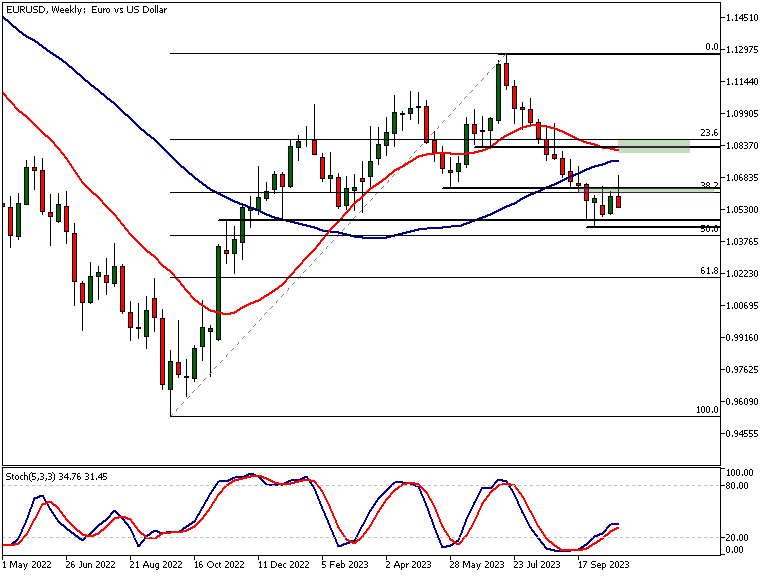
EURUSD Analysis, Weekly Chart
After a decline of approximately 825 pips, or -7.32%, from its high in July, the EURUSD pair has shown signs of stabilisation. The currency pair has formed higher weekly lows, indicating that it has reached a demand area. This suggests that bullish traders are attempting to push the market higher. Despite this, the strength of the U.S. Dollar has outweighed bullish sentiment for the Euro this week, negating gains made in Monday's rally.
Technical Indicators
Technical indicators are also providing early signals of a potential turnaround. The Stochastic oscillator has issued a buy signal and appears to be moving into bullish territory. These signs of bullishness are manifesting near significant market structure areas.
For instance, our EURUSD analysis shows the 50% Fibonacci retracement level is within close proximity, and the 1.0483 level has acted as both resistance and support in recent months. A bounce from this level previously led to a 7.5% rally in EURUSD.
Bullish and Bearish Scenarios
Should the bulls succeed in reversing the recent downtrend and push the pair above the 1.0615 - 1.0635 confluence area, the next target to watch would be the 1.0814 - 1.0866 range.
In this area, the 20-day Simple Moving Average (SMA) and the 23.6% Fibonacci retracement level are closely aligned with a market structure level. Conversely, if the current sideways movement proves to be a continuation pattern, a measured move target level at 1.0267 could become relevant.
Impact of ECB Decision
The forthcoming ECB rate decision could provide crucial insights into the market's direction. The bank's decision and the market's subsequent reaction will offer further evidence as to whether bullish traders will be successful in pushing the EURUSD pair higher.
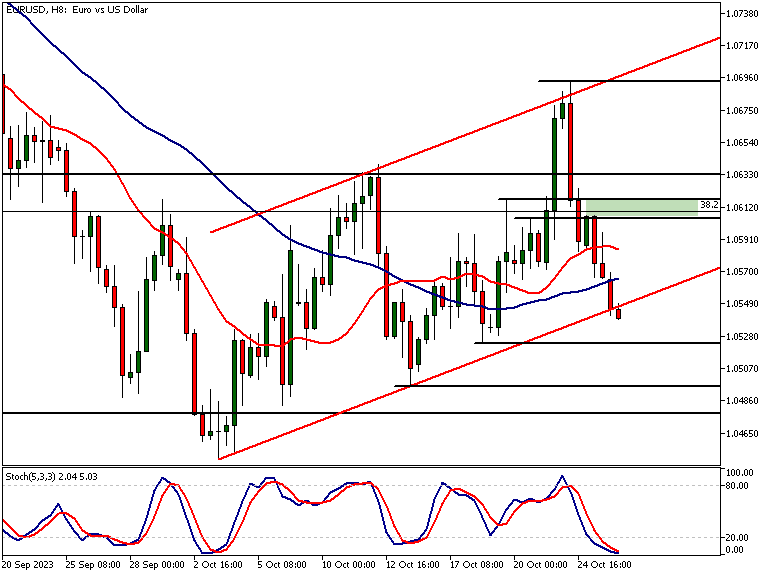
EURUSD Analysis, 8h Chart
Analysis of the EURUSD on the 8-hour chart indicates a possible breach below a bullish trend channel. The fast and slow Simple Moving Averages (SMAs) are oriented upwards, with the SMA(20) positioned above the SMA(50).
Additionally, the Stochastic oscillator is in the oversold territory. These factors collectively suggest a slight uptrend in the 8-hour timeframe and hint that the market may be approaching levels where buyers could re-enter.
Price Action Confirmation
Despite these indications, there is currently no price action confirming a bullish bias. Over the past 24 hours, the market has traded lower, casting doubt on the sustainability of the uptrend. It remains uncertain whether the support level at 1.0523 will be strong enough to stop the decline.
Confluence Areas and Targets
In this 8-hour timeframe, the closest confluence area lies between 1.0604 and 1.0617. Should the market attract buyers above the 1.0523 support level, this confluence zone may become the next target for traders. If the price breaks below 1.0523, the subsequent levels to watch would be 1.0495 and then possibly 1.0482.
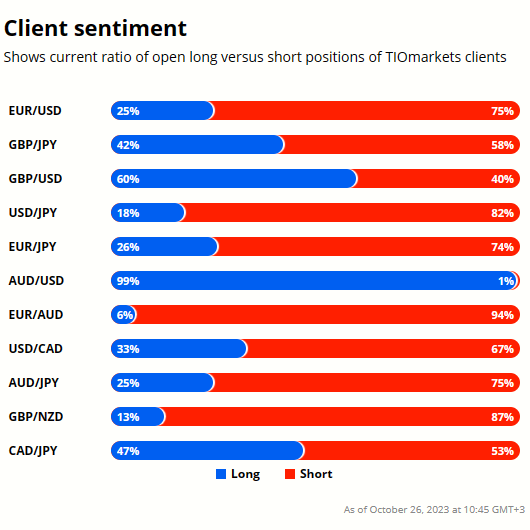
Client sentiment analysis
TIOmarkets clients are quite bearish on EURUSD with 75% of clients holding short positions and 25% holding long positions in the market.
Please remember that the retail trader client sentiment is a contrarian indicator as most of the retail traders are on average betting against the market trends. This is why, experienced traders tend to trade against the retail client sentiment. You can follow the TIOmarkets client sentiment live on our Forex dashboard.
While research has been undertaken to compile the above content, it remains an informational and educational piece only. None of the content provided constitutes any form of investment advice.
Tio Markets UK Limited is a company registered in England and Wales under company number 06592025 and is authorised and regulated by the Financial Conduct Authority FRN: 488900
Risk warning: CFDs are complex instruments and come with a high risk of losing money rapidly due to leverage. 82% of retail investor accounts lose money when trading CFDs with this provider. You should consider whether you understand how CFDs work and whether you can afford to take the high risk of losing your money. Professional clients can lose more than they deposit. All trading involves risk.
DISCLAIMER: Tio Markets offers an exclusively execution-only service. The views expressed are for information purposes only. None of the content provided constitutes any form of investment advice. The comments are made available purely for educational and marketing purposes and do NOT constitute advice or investment recommendation (and should not be considered as such) and do not in any way constitute an invitation to acquire any financial instrument or product. TIOmarkets and its affiliates and consultants are not liable for any damages that may be caused by individual comments or statements by TIOmarkets analysis and assumes no liability with respect to the completeness and correctness of the content presented. The investor is solely responsible for the risk of his/her investment decisions. The analyses and comments presented do not include any consideration of your personal investment objectives, financial circumstances, or needs. The content has not been prepared in accordance with any legal requirements for financial analysis and must, therefore, be viewed by the reader as marketing information. TIOmarkets prohibits duplication or publication without explicit approval.

Janne Muta holds an M.Sc in finance and has over 20 years experience in analysing and trading the financial markets.
