Risk disclaimer: 76% of retail investor accounts lose money when trading CFDs and Spreadbets with this provider. You should consider whether you understand how CFDs and Spreadbets work and whether you can afford to take the high risk of losing your money.
DAX technical analysis | The Market Trades Near March Low
BY Janne Muta
|October 30, 2023DAX Technical Analysis - As the market participants are preparing for the CPI data release today, the Euro area CPI on Tuesday and the Fed rate decision on Wednesday this week.
Our Dax technical analysis shows the DAX approaching March lows, while the bearish market is nearing an oversold state. The Israel - Hamas war remains an upside risk to inflation as energy prices would be likely to move higher in the event of the crisis escalating beyond Israel's borders.
Resistance and support levels are at 14,944 and 14,460 respectively. The daily chart places DAX near the lower end of the recent down trend's rage. Therefore, from a technical perspective, the downtrend could slow down. However, pay attention to the price action that follows today's data releases as strong deviations from expected values could create substantial volatility.
Summary of this DAX technical analysis report
- Market awaits German GDP today Euro Area CPI data, and Fed rate decision this week.
- DAX trades near March lows; bearish trend could slow down.
- The nearest key resistance level is at 14,944, while the nearest key support level is the March low at 14,460.
- Contra-trend rally in 4h timeframe possible has almost reached Friday’s high.
- Israel-Hamas conflict could push up energy prices and inflation if it escalates.
Read our full DAX technical analysis report below.
DAX Technical Analysis
DAX Technical Analysis, Weekly
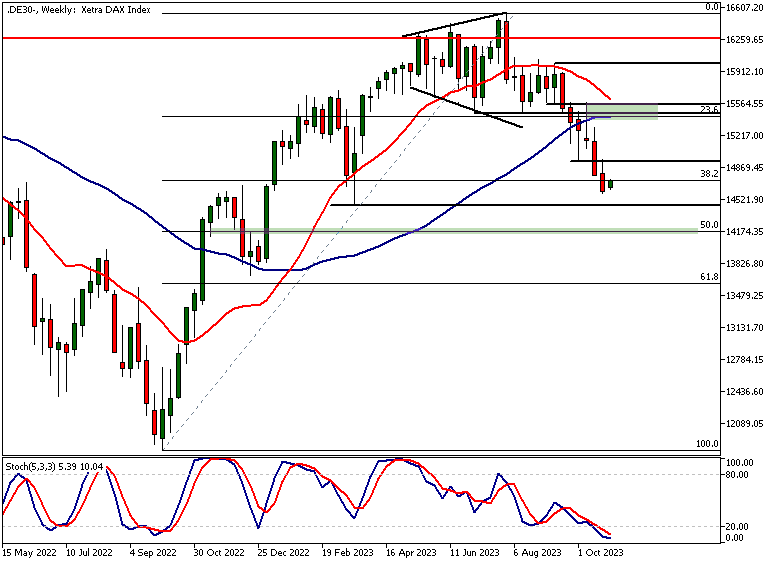
In the weekly chart, DAX has traded down almost to the levels where the rally started in March. Since then, the market has created a widening top, which we have highlighted in past DAX technical analyses. Apart from approaching the March lows, the market is oversold as per the stochastic oscillator.
Therefore, even though the market is still bearish in the weekly timeframe, the immediate downside could soon be limited. The nearest key resistance level is at 14,944, while the nearest key support level is the March low at 14,460. Should the market be able to create a sustainable rally above 14,944, we could see DAX trading up to 15,300 or so.
Confluence area
Note the confluence area above this price level at 15,420 - 15,600 where the 23.6% Fibonacci retracement level and the moving averages are closely aligned with a market structure level. Below the 14,460 level, the next key technical price level to focus on is the 50% Fibonacci retracement level that coincides with a market structure level at 14,161.
DAX Technical Analysis, Daily
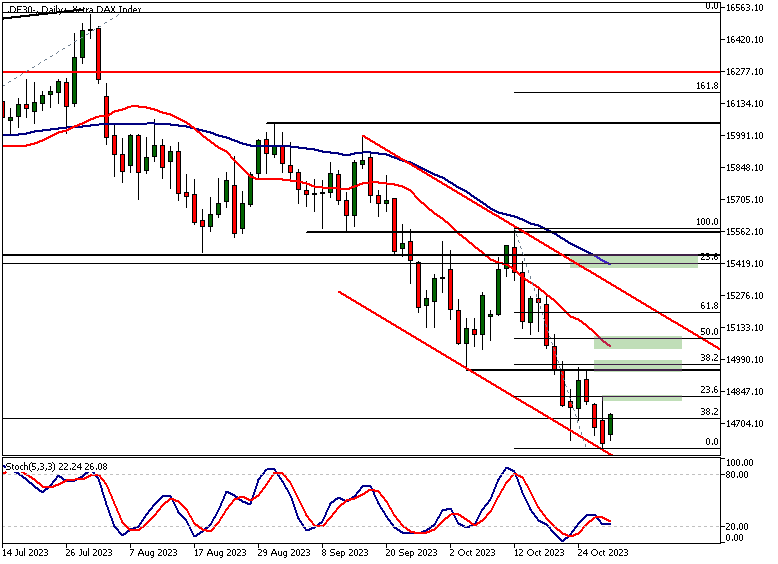
The daily chart shows the DAX index trading relatively close to the lower end of a descending trend channel. At the same time, the stochastic oscillator is at the oversold threshold. Therefore, a contra-trend move to the upside could be in the works.
If the bulls can push the market above Friday's high, we might see a retest of the 14,944 market structure level. Our DAX technical analysis, however, still shows the market in a bearish trend with the moving averages pointing lower, and the 20-period moving average is below the 50-period. This could mean that the market is still in "sell the rallies" mode.
Key Market Structure Levels
The nearest confluence level is at Friday's high where the 23.6% Fibonacci level is aligned with it. If we draw Fibonacci retracement levels from the October 12th high to the low created on Friday, the 38.2% Fibonacci retracement level coincides with the 14,944 market structure level.
This creates a technical confluence area very close to this price level. The next confluence area above this is formed by the 20-period moving average and the 50% Fibonacci retracement level at 15,049 - 15,083.
DAX Technical Analysis, 4h
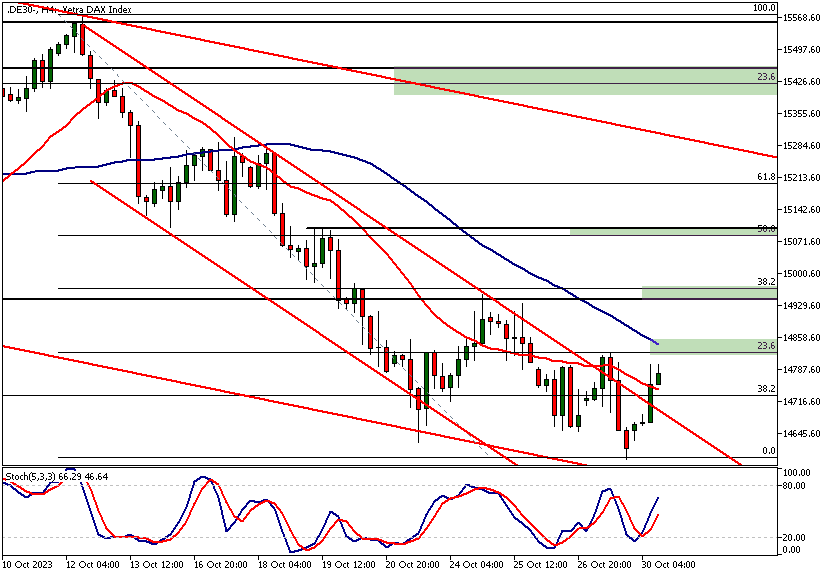
The DAX index has recently lost some of its downside momentum in the 4-hour chart. While the market was earlier trading neatly inside the bearish trend channel, it has recently started to break above the upper end of the channel.
This suggests that the bears are facing demand in this market as the major support level we referred to in the weekly Dax technical analysis is relatively close.
Potential Upside and Key Levels for DAX
This might lead to more upside in DAX, especially if there is a decisive rally above the nearest technical confluence zone at 14,825 and 14,853.
Alternatively, if the market creates yet another lower swing high, we could see the market retesting Friday's low at 14,587. After all, the trend is still bearish in this timeframe. Both moving averages are pointing lower, and the fast moving average is below the slow.

Client sentiment analysis
TIOmarkets clients are very mildly bearish on DAX with 54% of clients holding short positions and 46% holding long positions in the market.
Please remember that the retail trader client sentiment is a contrarian indicator as most of the retail traders are on average betting against the market trends. This is why, experienced traders tend to trade against the retail client sentiment. You can follow the TIOmarkets client sentiment live on our Forex dashboard.
The Next Key Risk Events
- German CPI
- Eurozone CPI
- FOMC rate decision

Potential DAX market moves
The proximity to March lows and an oversold state suggests the immediate downside could be limited. If the market rallies decisively above Friday’s high we might see a move to 14,942.
Despite nearing March lows, the DAX remains in a downtrend. An escalation in the Israel-Hamas conflict could spike energy costs, increasing inflation. This could move the market below the March low at 14,460.
How would you trade DAX today?
I hope this fundamental and technical DAX analysis helps you to make better informed trading decisions. Check the latest market analysis for other instruments and subscribe to receive them in your inbox as soon as they are published
While research has been undertaken to compile the above content, it remains an informational and educational piece only. None of the content provided constitutes any form of investment advice.
Tio Markets UK Limited is a company registered in England and Wales under company number 06592025 and is authorised and regulated by the Financial Conduct Authority FRN: 488900
Risk warning: CFDs are complex instruments and come with a high risk of losing money rapidly due to leverage. 82% of retail investor accounts lose money when trading CFDs with this provider. You should consider whether you understand how CFDs work and whether you can afford to take the high risk of losing your money. Professional clients can lose more than they deposit. All trading involves risk.
DISCLAIMER: Tio Markets offers an exclusively execution-only service. The views expressed are for information purposes only. None of the content provided constitutes any form of investment advice. The comments are made available purely for educational and marketing purposes and do NOT constitute advice or investment recommendation (and should not be considered as such) and do not in any way constitute an invitation to acquire any financial instrument or product. TIOmarkets and its affiliates and consultants are not liable for any damages that may be caused by individual comments or statements by TIOmarkets analysis and assumes no liability with respect to the completeness and correctness of the content presented. The investor is solely responsible for the risk of his/her investment decisions. The analyses and comments presented do not include any consideration of your personal investment objectives, financial circumstances, or needs. The content has not been prepared in accordance with any legal requirements for financial analysis and must, therefore, be viewed by the reader as marketing information. TIOmarkets prohibits duplication or publication without explicit approval.

Janne Muta holds an M.Sc in finance and has over 20 years experience in analysing and trading the financial markets.
