Risk disclaimer: 76% of retail investor accounts lose money when trading CFDs and Spreadbets with this provider. You should consider whether you understand how CFDs and Spreadbets work and whether you can afford to take the high risk of losing your money.
DAX Technical Analysis | Mixed reaction to US inflation data
BY Janne Muta
|January 12, 2024Dax technical analysis - The main equity indices in the US and Europe had a mixed reaction to the US inflation data yesterday. Dollar strength initially pushed the indices lower but the markets recovered later in the US session.
The US CPI data revealed a 0.3% monthly increase for both headline and core metrics. Year-over-year, the core CPI dipped slightly to 3.9%, surpassing the expected 3.8%, while the headline CPI rose to 3.4%, exceeding the 3.2% forecast. Notably, shelter costs, a key market focus, climbed by 0.4%, with the annual rate at an elevated 6.2%, albeit lower than the previous 6.5%. Services less rent increased by 0.6% month-on-month and 3.5% annually.
In response, Richmond Fed President Barkin highlighted the necessity for clear signs of inflation approaching the Fed's 2% target, particularly beyond the goods sector. He remains open to lowering interest rates once inflation meets the target, adopting a cautious stance without predicting future Fed actions. He notes that current inflation expectations aren't high.
Chicago Fed President Goolsbee pointed out housing inflation and supply shocks as major concerns. He advocates for a stringent threshold for Quantitative Tightening adjustments and warns against overly restrictive Fed policies. He views the economy's risks as more balanced, with policy decisions relying heavily on upcoming data. Goolsbee underscores inflation's pivotal role in determining interest rate adjustments and describes December's services inflation as better than expected, in contrast to housing inflation.
In her Speech ECB President Lagarde expressed confidence in managing inflation, expecting Eurozone inflation to stabilize at 1.9% by 2025. She acknowledges slower growth due to anti-inflation measures but sees salary increases outpacing inflation. Interest rates are at peak, with future cuts dependent on inflation data confirming ECB projections.
Today’s US PPI release is yet another inflation indicator. Analyst consensus sees a 0.2% rise in the core PPI and a 0.1% rise in the headline number.
Summary of This Dax Technical Analysis Report:
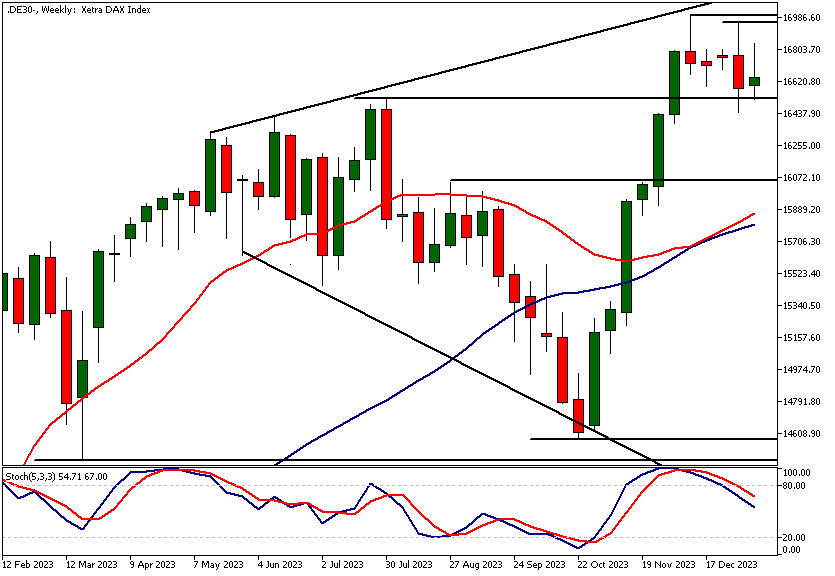
- Over the past five weeks, the Dax has been fluctuating, facing resistance at 16,960 and finding support at 16,531. The market risks a deeper decline to 16,050 if it falls below last week's low of 16,444. Otherwise, it could continue consolidating or reach new highs.
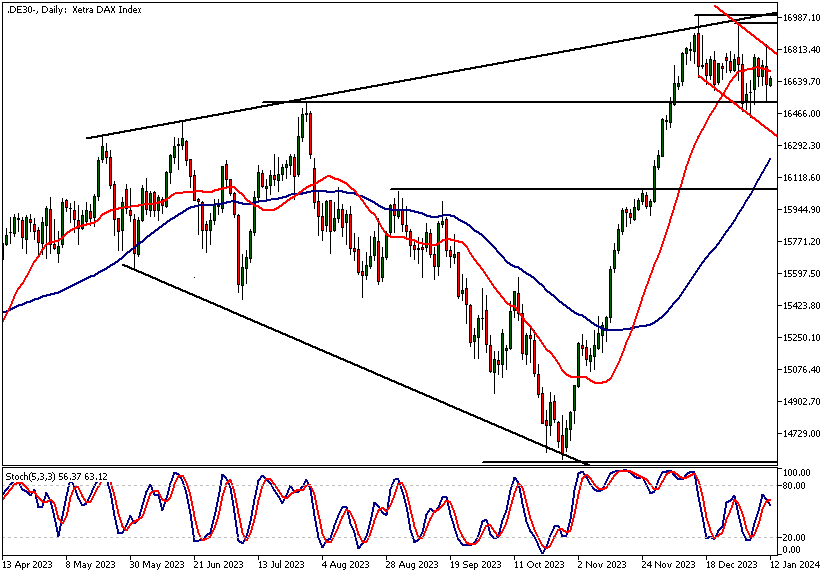
- Daily movements in the Dax show a bearish trend with lower highs and lows since last summer, indicating possible increased selling pressure. The market is currently supported at 16,531, with a potential drop to 16,050 or a rise to 16,839 based on future movements.
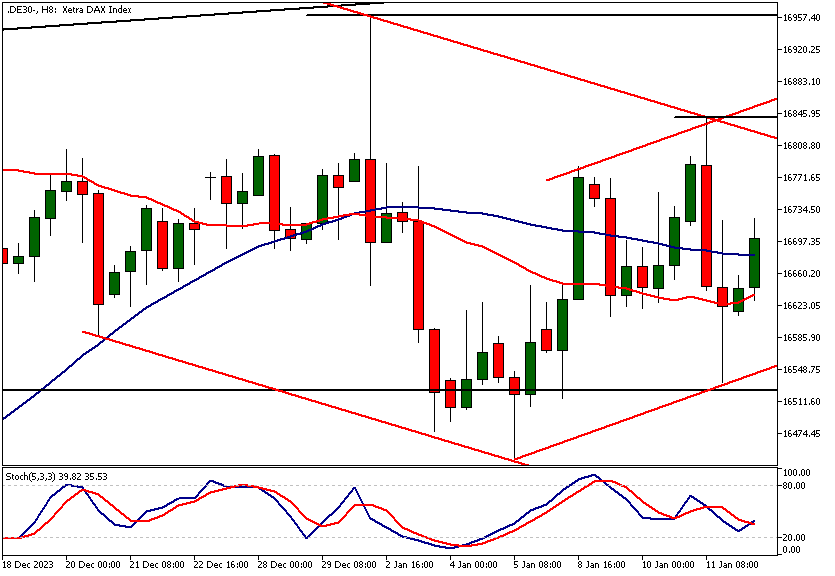
- Intraday analysis reveals a bullish sentiment, as indicated by a bullish rejection candle and a higher low at 16,533, suggesting active defence of the 16,531 level. The market may rise towards 16,750 or decline to 16,450, depending on the direction it takes.
Read the full Dax Technical Analysis report below.
Dax Technical Analysis

Weekly Dax Technical Analysis
Over the past five weeks, the Dax has traded sideways after reaching new all-time high (ATH) levels. The previous ATH at 16,531 now serves as a support level, while a rally towards the new ATH at 17,003 encountered selling pressure at 16,960, creating a resistance zone between these levels.
Last week's low at 16,444 is another pivotal price point to monitor. A break below this level, coupled with follow-through selling, could lead to a deeper retracement, potentially driving the market down to 16,050. Above 16,444, the market is poised to either continue consolidating or possibly achieve new ATHs. See our daily and intraday Dax technical analysis for key price levels.

Daily Dax Technical Analysis
YSince reaching the diagonal resistance line that initially signalled a widening top formation last summer, the Dax has been forming lower reactionary highs and lows.
These lower reactionary highs are bearish and might result in increased selling pressure. Nonetheless, the market finds support at the old ATH level of 16,531, which continues to hold despite being breached once. A decisive break below 16,444 could lead to a decline towards 16,050. Conversely, if the market remains above the 16,444 support level, a retest of the 16,839 level could occur.
Dax technical analysis based on moving averages also suggests a loss of momentum following a robust rally, as the SMA(20) is above the SMA(50) but has started to trend downwards.

Intraday Dax Technical Analysis
The eight-hour chart shows a bullish rejection candle and a higher reactionary low formed yesterday, indicating that bulls are actively defending the old ATH level of 16,531, as mentioned in our daily Dax technical analysis.
Although the moving averages are trending downwards, the higher swing low at 16,533 signals bullishness for today. Above this level, a move towards 16,750 is plausible, while a fall below 16,533 could see the index retreating to 16,450.

Client sentiment analysis
63% of clients trading DAX are holding long positions, while 37% are holding short positions. Client sentiment data is being provided by TIO Markets Ltd.
It’s good to remember that retail client trading sentiment is a contrarian indicator as most retail traders are on average trading against market price trends. This is why experienced traders tend to trade against the retail client sentiment. You can follow the TIOmarkets client sentiment live on our Forex dashboard.
The next key risk events impacting this market
- USD - Core PPI m/m
- USD - PPI m/m
- USD - Empire State Manufacturing Index
- USD - Core Retail Sales m/m
- USD - Retail Sales m/m
- USD - Industrial Production m/m
- EUR - ECB President Lagarde Speaks
- USD - Unemployment Claims
- USD - Building Permits
- USD - Philly Fed Manufacturing Index
- EUR - ECB President Lagarde Speaks
- USD - Prelim UoM Consumer Sentiment
- USD - Existing Home Sales
- USD - Prelim UoM Inflation Expectations
Potential Dax Market Moves
The Dax presents a mixed outlook. On the bullish side, maintaining above 16,444 could lead to a retest of 16,839 or even new highs, reflecting continued market strength. Conversely, a bearish scenario would see a break below 16,444, potentially driving the market down towards 16,050, indicating a deeper retracement and increased selling pressure.

How would you trade the Dax today?
I hope this Dax technical analysis helps you to make better informed trading decisions. Check the latest market analysis for other instruments and subscribe to receive them in your inbox as soon as they are published
While research has been undertaken to compile the above content, it remains an informational and educational piece only. None of the content provided constitutes any form of investment advice.
TIO Markets UK Limited is a company registered in England and Wales under company number 06592025 and is authorised and regulated by the Financial Conduct Authority FRN: 488900
Risk warning: CFDs are complex instruments and come with a high risk of losing money rapidly due to leverage. 73% of retail investor accounts lose money when trading CFDs with this provider. You should consider whether you understand how CFDs work and whether you can afford to take the high risk of losing your money. Professional clients can lose more than they deposit. All trading involves risk.
DISCLAIMER: TIO Markets offers an exclusively execution-only service. The views expressed are for information purposes only. None of the content provided constitutes any form of investment advice. The comments are made available purely for educational and marketing purposes and do NOT constitute advice or investment recommendation (and should not be considered as such) and do not in any way constitute an invitation to acquire any financial instrument or product. TIOmarkets and its affiliates and consultants are not liable for any damages that may be caused by individual comments or statements by TIOmarkets analysis and assumes no liability with respect to the completeness and correctness of the content presented. The investor is solely responsible for the risk of his/her investment decisions. The analyses and comments presented do not include any consideration of your personal investment objectives, financial circumstances, or needs. The content has not been prepared in accordance with any legal requirements for financial analysis and must, therefore, be viewed by the reader as marketing information. TIOmarkets prohibits duplication or publication without explicit approval.

Janne Muta holds an M.Sc in finance and has over 20 years experience in analysing and trading the financial markets.
