Risk disclaimer: 76% of retail investor accounts lose money when trading CFDs and Spreadbets with this provider. You should consider whether you understand how CFDs and Spreadbets work and whether you can afford to take the high risk of losing your money.
Crude Oil Technical Analysis | Signs of weakness after an 8% rally
BY Janne Muta
|October 19, 2023Crude oil technical analysis reveals potential weakness in the price action while fundamental data is supportive of higher oil prices. Despite several factors supporting oil prices—including a drop in U.S. crude stockpiles, heightened geopolitical tensions in the Middle East, and promising economic data from both China and the U.S.—the market has shown signs of weakening.
Possible Reversal
USOIL declined by nearly 3% from yesterday's high, forming a bearish shooting star candle in the daily chart. This suggests the possibility of a market reversal, casting doubt on the sustainability of the recent 8% rally that followed Hamas's attack on Israel. While the overall environment might imply a bullish trajectory, these bearish signs raise questions about the market's capacity to sustain its upward momentum.
Market at a Fibonacci Level
The weekly chart shows a 14.2% drop three weeks ago, yet the latest rally has moved prices back to the bull channel low that aligns with the 23.6% Fibonacci retracement level. Our crude oil technical analysis indicates that this could slow down the rally and perhaps even turn the market lower.
The key takeaways:
- The daily chart for USOIL indicates a bearish shooting star candle and a Stochastic oscillator above 80, suggesting potential market weakness. Immediate support levels are at 84.34, and a decisive break below could lead to 81.42 - 81.67.
- On the weekly timeframe, USOIL rallied to a confluence area at 87.66 - 88.47, aligning with the 23.6% Fibonacci retracement. If the rally falters here, a move down to 80.62, the 50% Fibonacci level, is likely.
- In the 4-hour chart, USOIL trades inside a bearish wedge. A decisive break below the minor confluence area could lead to a decline towards 84.34 - 84.92, and possibly 82.65 in extension.
- For those bullish on USOIL, breaking decisively above 87.66 - 88.47 could push the market to the 90.82 - 92.13 range. Beyond that, the next key resistance stands at 93.94.
- The SMA(20) and SMA(50) in the 4-hour chart are both pointing upwards, offering a bullish setup. However, traders should be cautious due to the bearish wedge pattern currently in play.
- Fundamental data, such as a drop in U.S. crude stockpiles and positive economic indicators from China and the U.S., support higher oil prices. However, the technicals are showing signs of potential reversal, making the market direction ambiguous.
The next key risk events for USOIL market are
- Philly Fed Manufacturing Index
- Fed Chair Powell Speaks
- US Flash Manufacturing PMI
- US Flash Services PMI
Read the full crude oil technical analysis report below.
Crude oil technical analysis

Crude oil technical analysis, weekly chart
After dropping hard (-14.2%) three weeks ago, the price of crude oil has rallied back to the bull channel low it earlier traded in. The channel low is roughly aligned with the 23.6% Fibonacci retracement level which together create a technical confluence area at 87.66 - 88.47. This area has slowed the rally down but hasn't turned the price lower yet.
USOIL Nears Critical Price Level
Our crude oil technical analysis shows, however, that USOIL is now trading near a critical price level that could significantly impact price action both intraday and over the coming days, perhaps even weeks.
If the supply inside this area is too much for the bulls and it can't be penetrated, crude oil creates a lower swing high right above the current market price. Technically this would indicate the market breaking below the 50% Fibonacci retracement level (80.62).
The 50% Fibonacci Retracement Level
Note, however, that this level is another confluence area with the SMA(20), and a market structure level coinciding with the 50% retracement level at 80.62. Therefore, it might take considerable supply to push the market decisively below this level.
The next key confluence area below 80.62 is at 77.22 - 78.14. This is where a key market structure level (an August swing low), the 61.8% Fibonacci level and the SMA(50) are aligned.
Potential for Break Above Confluence Area
On the other hand, should the market, however, break decisively above the 87.66 - 88.47 confluence area, crude oil technical analysis suggests we might see a move to the 90.82 - 92.13 range.
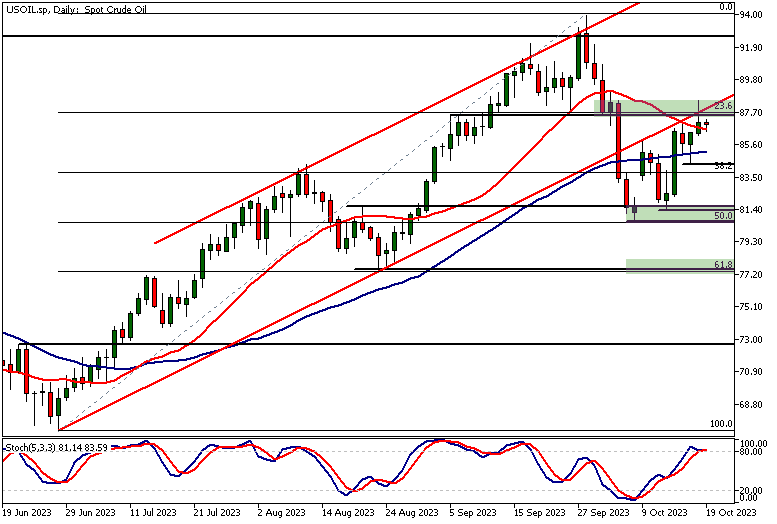
Crude oil technical analysis, daily chart
The daily chart shows how the market, after rallying over 8% in the aftermath of a geopolitical event, has now lost some momentum. The reason for the momentum loss is the confluence level we referred to in the weekly crude oil technical analysis above.
Yesterday's bearish shooting star candle and the Stochastic oscillator above the 80 level (threshold of oversold condition) indicate the market has become weaker.
Nearest Daily Support and Market Structure Levels
This could lead to a reversal in which case the nearest daily support level (84.34) could come into play. Below this, the next significant support can be found near the 50% Fibonacci retracement level where two market structure levels are closely aligned at 81.42 - 81.67.
Pivotal Price Action and Its Implications
The overall crude oil technical analysis indicates that the current price action is pivotal for the oil price. If the rally now fails and USOIL trades down to the 81.42 - 81.67 range, the lower reactionary high created in the process means the technical picture for the oil market turns more bearish.
Potential for Further Upside
On the other hand, if the bulls are able to rally the market beyond yesterday's high, we might see further upside in the market. If this were to happen, the bulls could be targeting levels near the next key resistance at 93.94.
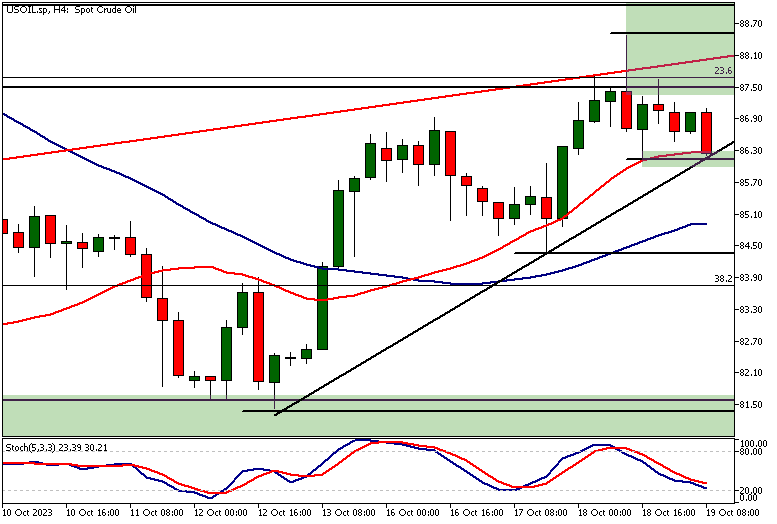
Crude oil technical analysis, 4h chart
The four-hour chart reveals a bullish setting in the moving averages. The fast SMA (20) is above the SMA(50) with both averages pointing higher.
However, USOIL trades inside a bearish wedge at the time of writing this. The market has retraced to a minor confluence area where the wedge low, the SMA(20) and a 4h support level coincide.
If the market breaks the level decisively, our crude oil technical analysis suggests the market could trade down to the 84.34 - 84.92 range and then possibly to 82.65 or so in extension. Above yesterday's high, look for a move to 90.51 or so.
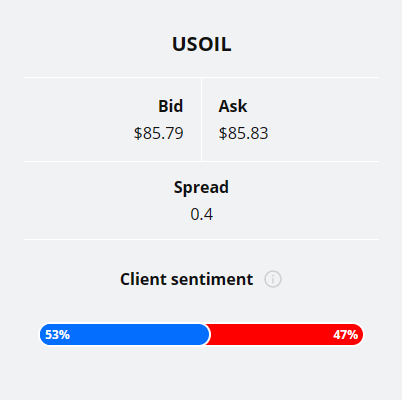
Client sentiment analysis
Retail traders do not provide strong indication on the USOIL market at the moment. 53% of TIOmarkets' clients are bullish on USOIL while 47% are short. As sentiment analysis doesn't give a strong indication we hope that our crude oil technical analysis helps our readers to make better trading decisions.
Please remember that the retail trader client sentiment is a contrarian indicator as most of the retail traders are on average betting against the market trends. This is why, experienced traders tend to trade against the retail client sentiment. You can follow the TIOmarkets client sentiment live on our Forex dashboard.
Read more crude oil technical analysis
Read more crude oil technical analysis

The next main risk events
- USD - Unemployment Claims
- USD - Philly Fed Manufacturing Index
- USD - Existing Home Sales
- USD - Fed Chair Powell Speaks
- USD - FOMC Member Harker Speaks
- CNY - 1-y Loan Prime Rate
- CNY - 5-y Loan Prime Rate
- NZD - RBNZ Statement of Intent
For more information and details see the TIOmarkets economic calendar.
While research has been undertaken to compile the above content, it remains an informational and educational piece only. None of the content provided constitutes any form of investment advice.
Tio Markets UK Limited is a company registered in England and Wales under company number 06592025 and is authorised and regulated by the Financial Conduct Authority FRN: 488900
Risk warning: CFDs are complex instruments and come with a high risk of losing money rapidly due to leverage. 82% of retail investor accounts lose money when trading CFDs with this provider. You should consider whether you understand how CFDs work and whether you can afford to take the high risk of losing your money. Professional clients can lose more than they deposit. All trading involves risk.
DISCLAIMER: Tio Markets offers an exclusively execution-only service. The views expressed are for information purposes only. None of the content provided constitutes any form of investment advice. The comments are made available purely for educational and marketing purposes and do NOT constitute advice or investment recommendation (and should not be considered as such) and do not in any way constitute an invitation to acquire any financial instrument or product. TIOmarkets and its affiliates and consultants are not liable for any damages that may be caused by individual comments or statements by TIOmarkets analysis and assumes no liability with respect to the completeness and correctness of the content presented. The investor is solely responsible for the risk of his/her investment decisions. The analyses and comments presented do not include any consideration of your personal investment objectives, financial circumstances, or needs. The content has not been prepared in accordance with any legal requirements for financial analysis and must, therefore, be viewed by the reader as marketing information. TIOmarkets prohibits duplication or publication without explicit approval.

Janne Muta holds an M.Sc in finance and has over 20 years experience in analysing and trading the financial markets.
