Risk disclaimer: 76% of retail investor accounts lose money when trading CFDs and Spreadbets with this provider. You should consider whether you understand how CFDs and Spreadbets work and whether you can afford to take the high risk of losing your money.
CHFJPY analysis | Ueda effect on the CHFJPY uptrend
BY Janne Muta
|September 12, 2023Our CHFJPY analysis report provides an in-depth analysis of the CHFJPY currency pair, examining the market from weekly, daily, and 4-hour timeframes. The CHFJPY pair has seen a commendable rally, exceeding a 21% increase from its January lows. While the trend has been largely bullish, a minor retracement of 1.7% has been observed recently.
Technical indicators like the 20-period and 50-period Simple Moving Averages (SMA) are pointing upwards in the weekly timeframe chart, while the Stochastic Oscillator shows a slight drift downwards, indicating a loss of upside momentum.
CHFJPY trading right above a critical price zone
On a daily timeframe, the CHFJPY is trading at a critical point, hinged closely to a key support level at 164.00 and the 50-period SMA at 163.64. A break below 163.64 would signify an exit from the bullish trend channel, a development that would be notably bearish.
Central Bank Sentiment: The Bank of Japan
In a recent interview with the Yomiuri media group, Bank of Japan Governor Ueda expressed the view that by the close of 2023, the central bank may have sufficient data to evaluate the trajectory of wage increases. Such an assessment is a prerequisite for reducing the current monetary stimulus.
Should the Bank become confident that both prices and wages are on a path to sustainable growth, then the option to terminate its negative interest rate policy could be considered.
CHFJPY analysis, key takeaways
- Key Support Level at 164.00. The daily timeframe for CHFJPY highlights a crucial support level at 164.00. This level is pivotal for immediate trend continuation. If the market maintains above this level, it signals a bullish scenario, especially as it is close to the SMA(50) at 163.64.
- Potential Bearish Development. A break below the 163.64 level on the daily timeframe would take the market outside its bullish trend channel. This would also mark the first time since March that the CHFJPY trades below its SMA(50), indicating a bearish turn.
- If the 163.64 - 164.00 support area is decisively breached, the next focus should be on the 161.95–162.65 zone. This area is a technical confluence created by minor weekly support and the 23.6% Fibonacci retracement level.
- Bank of Japan Governor Ueda hinted at exiting negative interest rates by year-end if the data on wages supports the decision. This rallied the JPY against the other currencies as the trading week started.
The next key risk events for this currency pair are: the SNB and the BoJ rate decisions next week. Read our full CHFJPY analysis below.
CHFJPY analysis
Weekly CHFJPY analysis
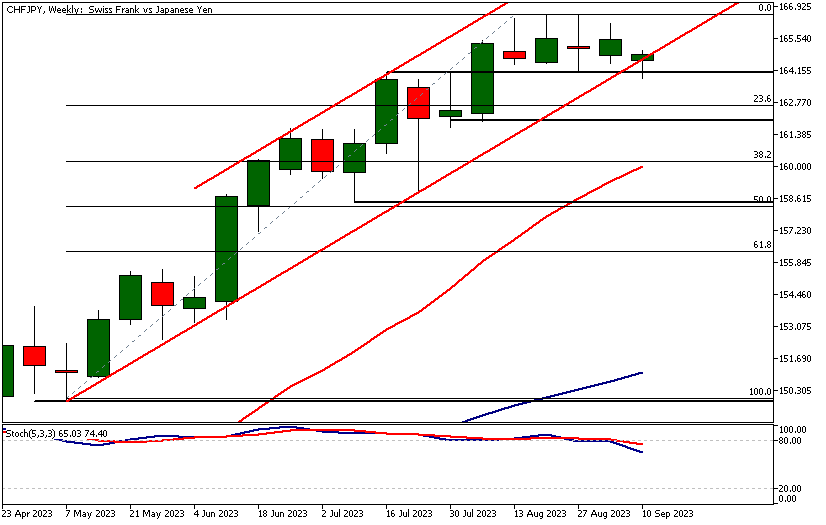
The CHFJPY has rallied impressively this year. The rally from the January low has exceeded 21%. The market has moved higher with only small retracements along the way. There has been a minor retracement lately (1.7%) as the market has lost some of its upside momentum.
This has resulted in a tight sideways range above a support level (a former resistance) at 164.00. In July and August, the market had to work through some supply around this level which resulted in the creation of the level.
The 20-period moving average points strongly higher while the slower 50-period SMA also points up (but to a lesser degree). The Stochastic Oscillator is drifting lower though. The CHFJPY analysis using the combined message from these indicators shows that the market is trending strongly higher but it has also lost some of the upside momentum that has driven the pair higher this year.
Daily CHFJPY analysis
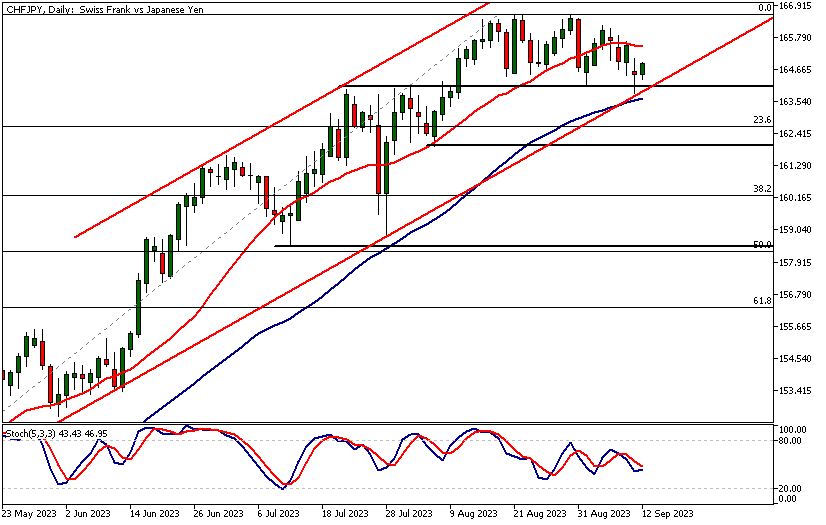
The daily timeframe CHFJPY analysis shows the market trading at a crucial juncture. The recent sideways range has moved the market to the lower end of a bullish trend channel. This low is close to the key support level at 164.00 and the SMA(50) at 163.64.
Therefore, the following price action around this area is of high importance: a break below 163.64 would move the market outside the bullish trend channel while a rally from the current levels would indicate trend continuation.
The break lower would also move the market, for the first time since March this year, below the SMA(50). This would be a quite bearish development. However, CHFJPY has reacted to the channel low and is trading higher at the time of writing this. Therefore, today’s price action is of high importance. We need to see a continuation of the rally to gain confirmation for the bullish indication the reaction has given.
Moving Averages: A Still-Bullish Picture
Both moving averages, the SMA(50) and the SMA(20) are still bullish even though the fast SMA has started to contract slightly. The fast-moving average is well above the slow average though. The indication again is that the uptrend is still intact but there has been less upside momentum.
As per classical technical analysis, a market remains in an uptrend as long as the most recent key support level isn’t violated. CHFJPY analysis shows the 163.64 - 164.00 support area is the key to the immediate trend continuation. This is where the market currently trading higher from.
Watershed time for CHFJPY
The key point here is the market reaction today. If we see a strong rally from level today the buyers could move this market to the latest highs and perhaps even beyond. However, if the level is violated decisively, look for a move down to the 161.95 – 162.65 zone. This is a technical confluence area created by a minor weekly support level and the 23.6% Fibonacci level.
Note, that the SMA(50) is not far below yesterday’s low (163.83). The fact that the market started buying so close (30 pips or so) to the SMA(50) could mean that the bulls are paying attention to this indicator, especially so as it roughly coincides with the bull channel low. CHFJPY analysis suggests that if the bulls can keep the market above the 164 level, look for a move to the latest YTD (166.55).

4h CHFJPY analysis
In the 4h, the trend is down with the price channel and the moving averages pointing lower. However, the chart also shows the CHFJPY pair bouncing higher from the technical confluence area discussed above.
The market has created a bearish shooting star at a resistance level. If this bearishness continues, the market might break the nearest higher swing low (at 164.31). However, if the bulls could take CHFJPY to the bear channel high at 165.36 and close the gap created by the publication of the comments made by head of BoJ over the weekend.
The BoJ governor Ueda suggested the BoJ might move away from the extremely accommodative monetary policy. Use our CHFJPY analysis to navigate the market as traders are still reacting to the possibility of the BoJ tightening their monetary policy.
JPY and CHF currency strength analysis
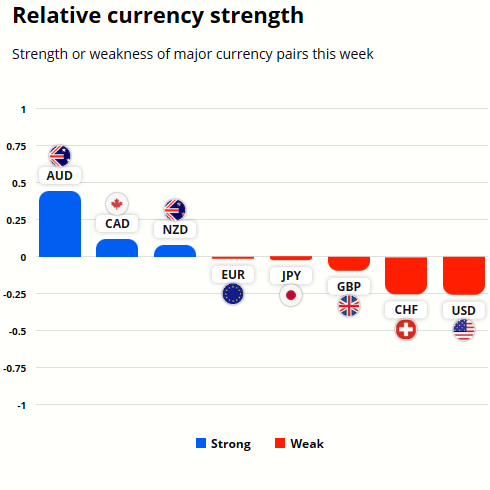
After an almost a year long rally CHF has lost some ground this week and is currently weaker than the JPY. The strongest currency is the AUD and the weakest USD.
To gain better understanding on the potential future price moves in these currencies refer to the CHFJPY analysis in this report.
Client sentiment analysis
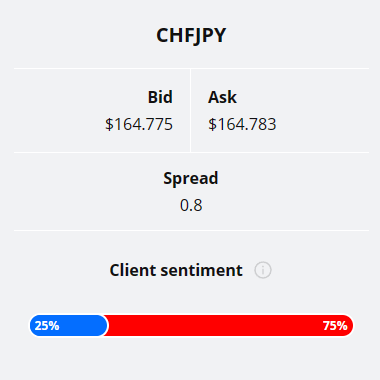
TIOmarkets clients are quite bearish CHFJPY currency pair with 75% of them short this currency pair while 25% are bullish on the market.
Please remember that the retail trader client sentiment is a contrarian indicator as most of the retail traders are on average betting against the market trends. This is why, experienced traders tend to trade against the retail client sentiment. You can follow the TIOmarkets client sentiment live on our Forex dashboard.
The key findings of the NZDJPY analysis:
- Bank of Japan Governor Ueda hinted at exiting negative interest rates by year-end if the data on wages supports the decision. This rallied the JPY against the other currencies as the trading week started.
- The daily timeframe for CHFJPY highlights a crucial support level at 164.00. This level is pivotal for immediate trend continuation. If the market maintains above this level, it signals a bullish scenario, especially as it is close to the SMA(50) at 163.64.
- A break below the 163.64 level on the daily timeframe would take the market outside its bullish trend channel. This would also mark the first time since March that the CHFJPY trades below its SMA(50), indicating a bearish turn.
- If the 163.64 - 164.00 support area is decisively breached, the next focus should be on the 161.95–162.65 zone. This area is a technical confluence created by minor weekly support and the 23.6% Fibonacci retracement level.
- The CHFJPY is trading in a sideways range above a support level (a former resistance) at 164.00. The market has lost some of its upside momentum but the 20-period moving average points strongly higher while the slower 50-period SMA also points up (but to a lesser degree).

The next main risk events
- GBP - GDP
- USD - Core CPI
- USD - CPI
- AUD - Employment Change
- AUD - Unemployment Rate
- EUR - Main Refinancing Rate
- EUR - Monetary Policy Statement
- USD - Core PPI
- USD - Core Retail Sales
- USD - PPI
- USD - Retail Sales
- USD - Unemployment Claims
- EUR - ECB Press Conference
- CNY - Industrial Production
- CNY - Retail Sales
- USD - Empire State Manufacturing Index
- USD - Industrial Production
- USD - Prelim UoM Consumer Sentiment
- USD - Prelim UoM Inflation Expectations
For more information and details see the TIOmarkets economic calendar.
While research has been undertaken to compile the above content, it remains an informational and educational piece only. None of the content provided constitutes any form of investment advice.
Tio Markets UK Limited is a company registered in England and Wales under company number 06592025 and is authorised and regulated by the Financial Conduct Authority FRN: 488900
Risk warning: CFDs are complex instruments and come with a high risk of losing money rapidly due to leverage. 82% of retail investor accounts lose money when trading CFDs with this provider. You should consider whether you understand how CFDs work and whether you can afford to take the high risk of losing your money. Professional clients can lose more than they deposit. All trading involves risk.
DISCLAIMER: Tio Markets offers an exclusively execution-only service. The views expressed are for information purposes only. None of the content provided constitutes any form of investment advice. The comments are made available purely for educational and marketing purposes and do NOT constitute advice or investment recommendation (and should not be considered as such) and do not in any way constitute an invitation to acquire any financial instrument or product. TIOmarkets and its affiliates and consultants are not liable for any damages that may be caused by individual comments or statements by TIOmarkets analysis and assumes no liability with respect to the completeness and correctness of the content presented. The investor is solely responsible for the risk of his/her investment decisions. The analyses and comments presented do not include any consideration of your personal investment objectives, financial circumstances, or needs. The content has not been prepared in accordance with any legal requirements for financial analysis and must, therefore, be viewed by the reader as marketing information. TIOmarkets prohibits duplication or publication without explicit approval.

Janne Muta holds an M.Sc in finance and has over 20 years experience in analysing and trading the financial markets.
