Risk disclaimer: 76% of retail investor accounts lose money when trading CFDs and Spreadbets with this provider. You should consider whether you understand how CFDs and Spreadbets work and whether you can afford to take the high risk of losing your money.
AUDUSD Technical Analysis | US CPI report boosts USD
BY Janne Muta
|December 12, 2023AUDUSD Technical Analysis – The USD strengthened today after the US Core CPI met market expectations. The Core Consumer Price Index for November, excluding food and energy, increased by 0.3% from October, matching market expectations and slightly accelerating from the previous month's 0.2% rise.
The annual core CPI inflation rate stood at 4%, the lowest since September 2021, aligning with market forecasts. Overall, consumer prices increased by 0.1% month-on-month, defying expectations of no change, driven by rising shelter costs and a decline in gasoline prices. Annual inflation dipped to 3.1% in November, in line with forecasts.
Here's a recap of recent key Australian macroeconomic data points: With the Australian economy slowing down in late 2023, the Reserve Bank of Australia (RBA) decided to maintain its cash rates at 4.35%. The central bank aimed to gauge the impact of previous rate hikes before proceeding further.
Australian business confidence has plummeted, hitting its lowest levels since 2012, with conditions weakening in various sectors. Labour and purchase cost growth increased, exerting upward pressure on prices. At the same time, consumer sentiment remained pessimistic due to surging living costs and higher interest rates, although the RBA's decision to hold rates provided some relief.
Furthermore, Australia's Q3 2023 GDP growth of 0.2% fell short of expectations, driven by reduced household consumption, while public investment in health and infrastructure projects bolstered fixed investment. Despite economic headwinds, the annual GDP growth outperformed forecasts at 2.1%.
Summary of This AUDUSD Technical Analysis Report:
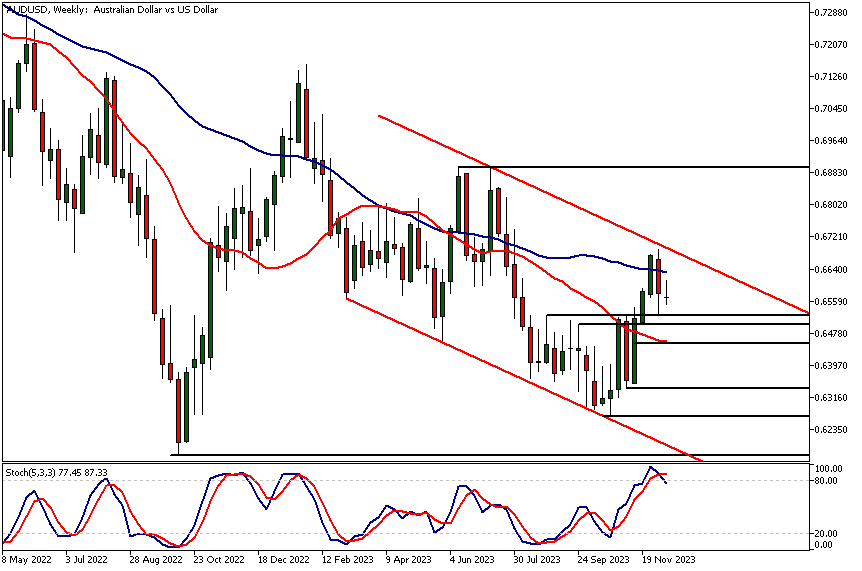
- AUDUSD rallied to the high of the descending trend channel last week and has since traded within last week's price range. The nearest key weekly support level at 0.6522 has limited market moves on the downside, while the nearest technical resistance above is the top of the descending trend channel.
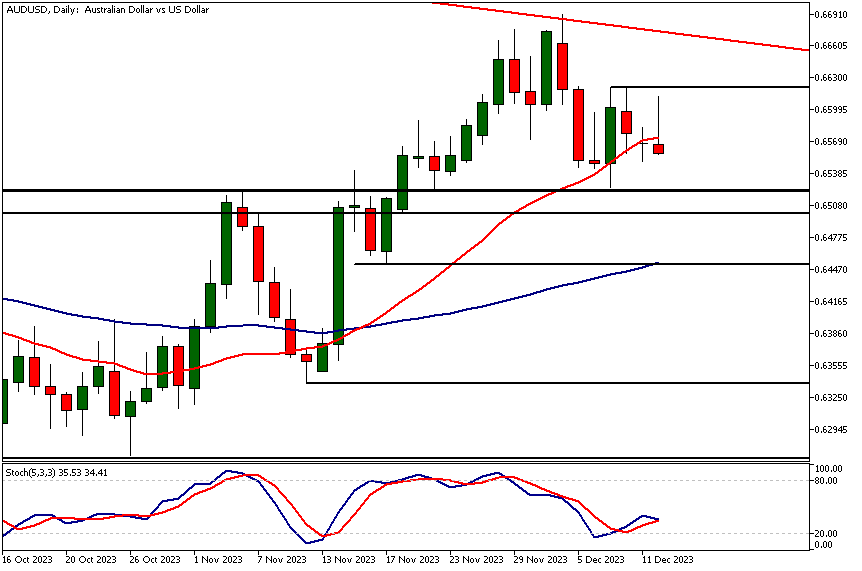
- The daily chart shows how the market has tested the market structure area mentioned in the weekly AUDUSD technical analysis section above. The market is now trading in a tight sideways range between 0.6525 and 0.6620.
- AUDUSD has created a lower reactionary high in the 8-hour chart, suggesting that selling pressure is building and the currency pair could move down to the market structure area (0.6500 and 0.6522) described above in the weekly AUDUSD technical analysis section.
Read the full AUDUSD technical analysis report below.
AUDUSD Technical Analysis

Weekly AUDUSD Technical Analysis
AUDUSD rallied to the high of the descending trend channel last week and has since traded within last week's price range. The nearest key weekly support level at 0.6522 has limited market moves on the downside, while the nearest technical resistance above is the top of the descending trend channel.
Thus, the market remains in a downtrend on the weekly chart, with moving averages pointing lower and the fast-moving average positioned below the slow one. Indicator-driven AUDUSD technical analysis therefore suggests the market is bearish, with the stochastic oscillator in the overbought area and possibly giving a sell signal when this week's candle closes on Friday.
Market structure area
The key market structure area between 0.6500 and 0.6522 remains a major support zone. This significant market structure area has resisted price movements on several occasions since the end of August.
If AUDUSD can attract sufficient buying above the 20-period moving average (currently at 0.6456) to form a higher reactionary low, a bullish breakout from the descending trend channel could occur. Alternatively, a drop to 0.6370 could be possible below the SMA(20).

Daily AUDUSD Technical Analysis
The daily chart shows how the market has tested the market structure area mentioned in the weekly AUDUSD technical analysis section above. The market is now trading in a tight sideways range between 0.6525 and 0.6620.
A decisive break above the 0.6620 level would possibly open the way to the nearest key resistance level at 0.6690. Below 0.6500, a move down to 0.6452 could be likely. Note that the 50-period moving average is closely aligned with this level, adding to its technical significance.
SMA indications
Moving average-based AUDUSD technical analysis indicates the market is bullish in this timeframe, as both moving averages are pointing higher, and the 20-period SMA is trading above the 50-period SMA. However, the weekly downtrend and lack of momentum in the daily and 8h charts, and the USD strengthening after the CPI data adds to the risk of the market could move lower.

AUDUSD Technical Analysis, 8h
AUDUSD has created a lower reactionary high in the 8-hour chart, suggesting that selling pressure is building and the currency pair could move down to the market structure area (0.6500 and 0.6522) described above in the weekly AUDUSD technical analysis section.
The 20-period moving average has crossed below the 50-period, supporting the idea that the market is losing momentum in this timeframe and might move lower from the current levels. Alternatively, if the market can attract buying around 0.6550, traders might try to challenge the resistance at 0.6612.

Client sentiment analysis
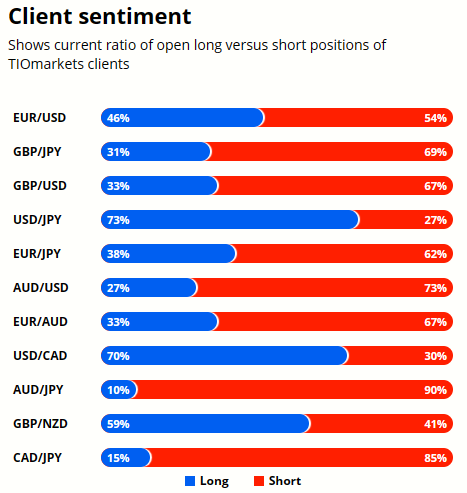
A majority of TIOmarkets' clients are bearish on AUDUSD with 73% holding short positions while only 23% are optimistic and hold long positions.
It’s good to remember that the retail trader client sentiment is a contrarian indicator as most of the retail traders are on average betting against the market trends. This is why, experienced traders tend to trade against the retail client sentiment. You can follow the TIOmarkets client sentiment live on our Forex dashboard.
The next key risk events impacting this market:
- USD - Core PPI m/m
- USD - PPI m/m
- USD - Federal Funds Rate
- USD - FOMC Economic Projections
- USD - FOMC Statement
- USD - FOMC Press Conference
- AUD - Employment Change
- AUD - Unemployment Rate
- USD - Core Retail Sales m/m
- USD - Retail Sales m/m
- USD - Unemployment Claims
- USD - Empire State Manufacturing Index
- USD - Industrial Production m/m
- USD - Flash Manufacturing PMI
- USD - Flash Services PMI
Potential AUDUSD Market Moves
If AUDUSD can attract sufficient buying above the 20-period moving average (currently at 0.6456) to form a higher reactionary low, a bullish breakout from the descending trend channel could occur. Alternatively, a drop to 0.6370 could be possible below the SMA(20).

How Would You Trade AUDUSD Today?
I hope this AUDUSD technical analysis helps you to make better informed trading decisions. Check the latest market analysis for other instruments and subscribe to receive them in your inbox as soon as they are published
While research has been undertaken to compile the above content, it remains an informational and educational piece only. None of the content provided constitutes any form of investment advice.
TIO Markets UK Limited is a company registered in England and Wales under company number 06592025 and is authorised and regulated by the Financial Conduct Authority FRN: 488900
Risk warning: CFDs are complex instruments and come with a high risk of losing money rapidly due to leverage. 73% of retail investor accounts lose money when trading CFDs with this provider. You should consider whether you understand how CFDs work and whether you can afford to take the high risk of losing your money. Professional clients can lose more than they deposit. All trading involves risk.
DISCLAIMER: TIO Markets offers an exclusively execution-only service. The views expressed are for information purposes only. None of the content provided constitutes any form of investment advice. The comments are made available purely for educational and marketing purposes and do NOT constitute advice or investment recommendation (and should not be considered as such) and do not in any way constitute an invitation to acquire any financial instrument or product. TIOmarkets and its affiliates and consultants are not liable for any damages that may be caused by individual comments or statements by TIOmarkets analysis and assumes no liability with respect to the completeness and correctness of the content presented. The investor is solely responsible for the risk of his/her investment decisions. The analyses and comments presented do not include any consideration of your personal investment objectives, financial circumstances, or needs. The content has not been prepared in accordance with any legal requirements for financial analysis and must, therefore, be viewed by the reader as marketing information. TIOmarkets prohibits duplication or publication without explicit approval.

Janne Muta holds an M.Sc in finance and has over 20 years experience in analysing and trading the financial markets.
