Risk disclaimer: 76% of retail investor accounts lose money when trading CFDs and Spreadbets with this provider. You should consider whether you understand how CFDs and Spreadbets work and whether you can afford to take the high risk of losing your money.


Top gainers
Currency pairs that gained the most this week
As of July 27, 2024 at 14:48 UTC
Top losers
Currency pairs that lost the most this week
As of July 27, 2024 at 14:48 UTC
Relative currency strength
Strength or weakness of major currency pairs this week
JPY
CHF
USD
EUR
GBP
CAD
NZD
AUD
As of July 27, 2024 at 14:48 UTC
Client sentiment
Shows current ratio of open long versus short positions of TIOmarkets clients
As of July 27, 2024 at 14:48 UTC
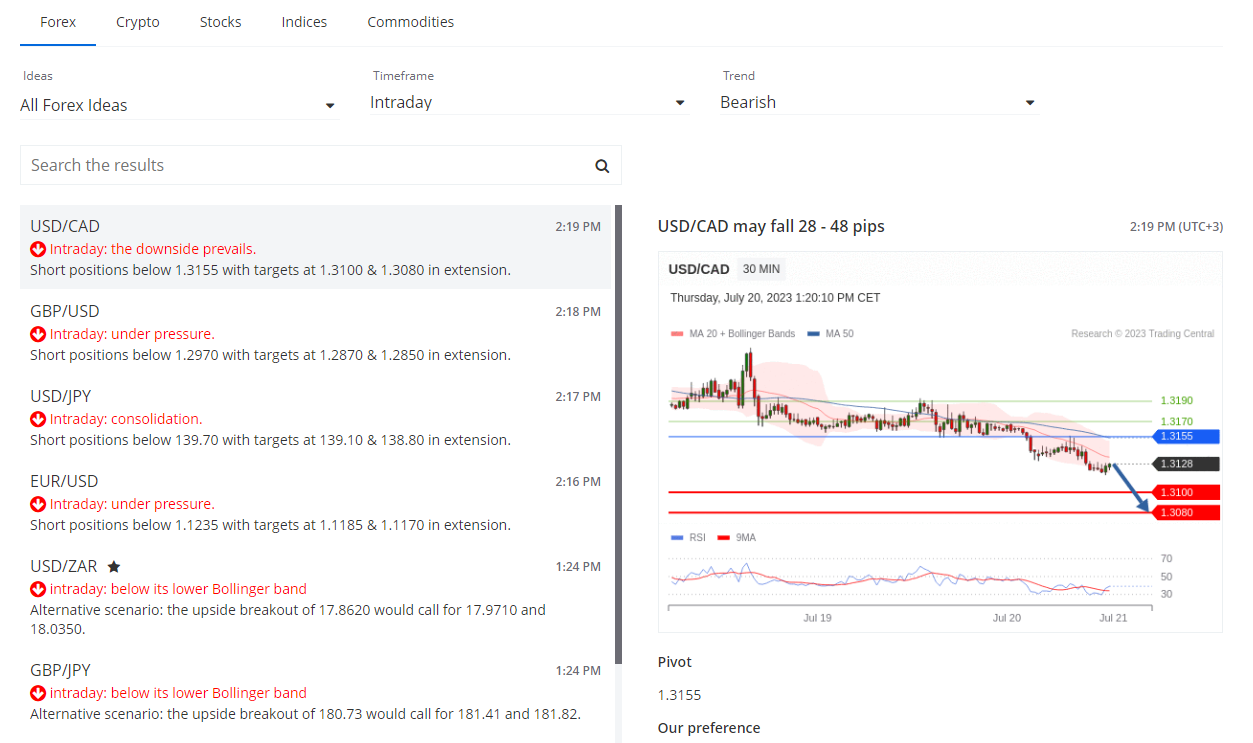
Technical analysis
Actionable trading plans from Trading Central
Technical indicators
A summary of moving averages and oscillating indicators over multiple timeframes
Oscilators


Moving Averages
Summary
Oscilators
Moving Averages
Summary
Oscilators
Moving Averages
Summary
Oscilators
Moving Averages
Summary
Latest market news
Daily market analysis from our blog
Todays economic data releases
Data provided by Trading Central